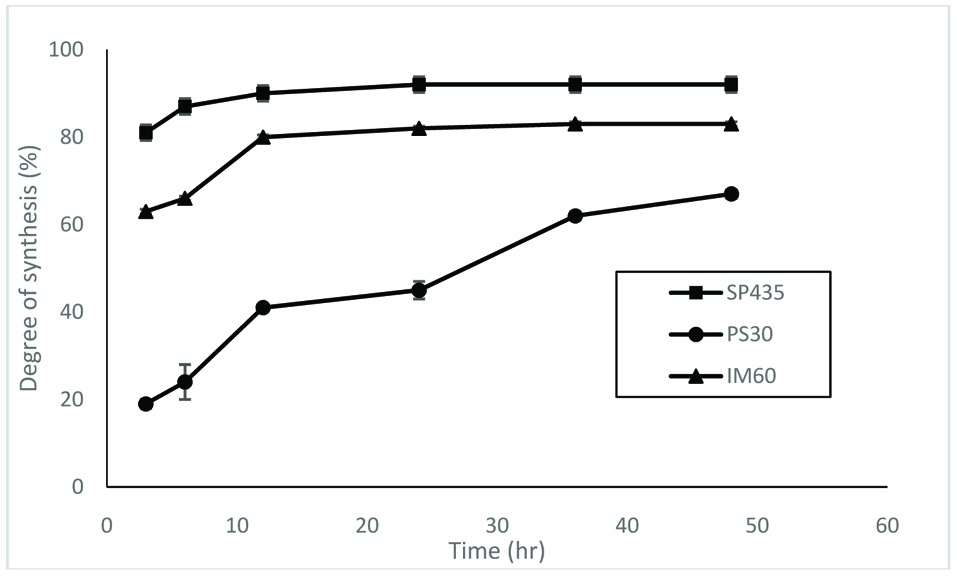
Figure 1.
Time course of esterification by lipases. The reaction was conducted at 30 °C.
| Journal of Food Bioactives, ISSN 2637-8752 print, 2637-8779 online |
| Journal website www.isnff-jfb.com |
Original Research
Volume 4, Number , December 2018, pages 123-129
Two step-production of acylglycerols containing a high proportion of docosapentaenoic acid from marine omega-3 oil and their oxidative stability
Figures
Time course of esterification by lipases. The reaction was conducted at 30 °C.
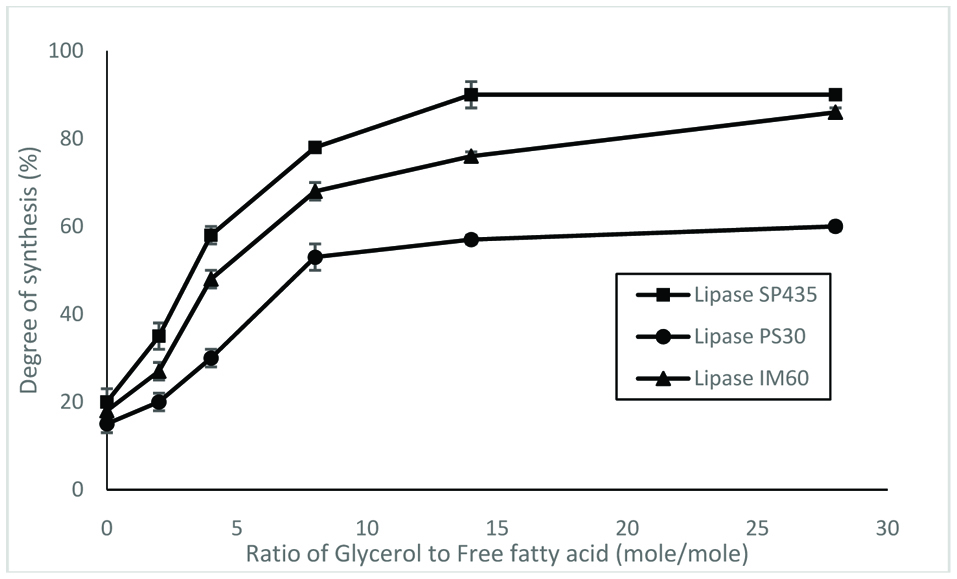
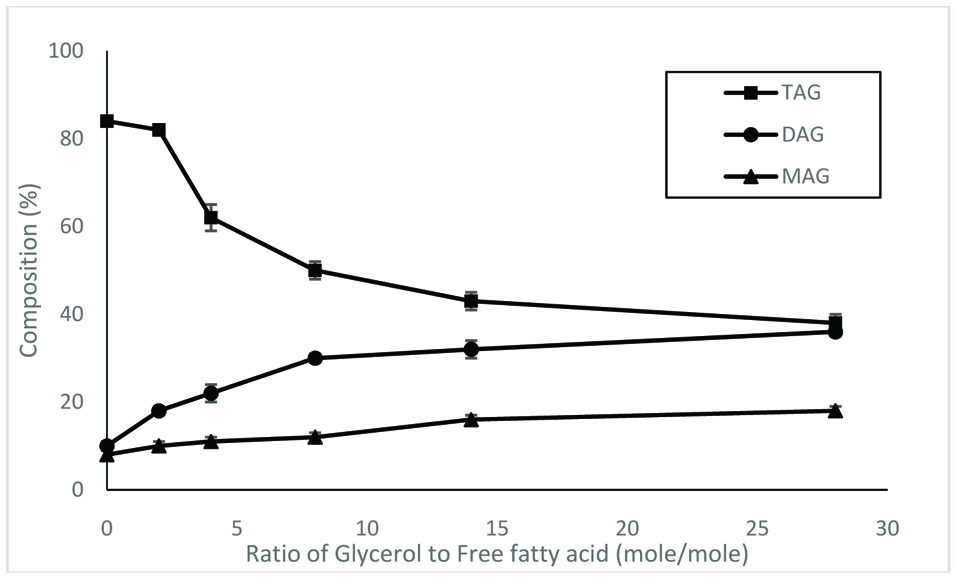
Effects of glycerol content on degree of synthesis by lipases. The reaction was conducted at 30 °C for 24 hr.
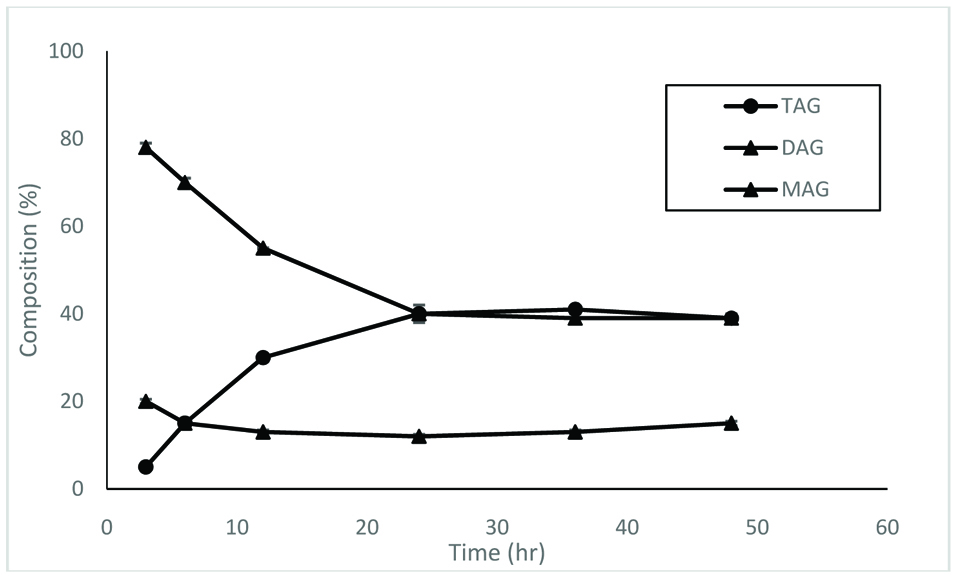
Distribution of acylglycerols synthesized by lipase SP435 over different time periods. The reaction was conducted at 30 °C.
Distribution of acylglycerols synthesized by lipase SP435 over different time periods. The reaction was conducted at 30 °C.
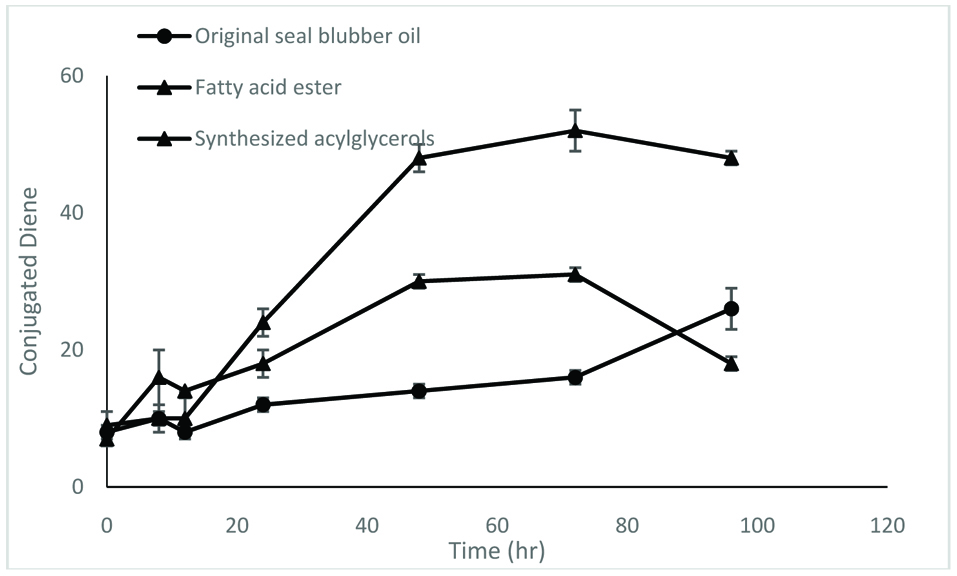
Conjugated diene value of different samples. The test was carried out at 60 °C for 96 hr.
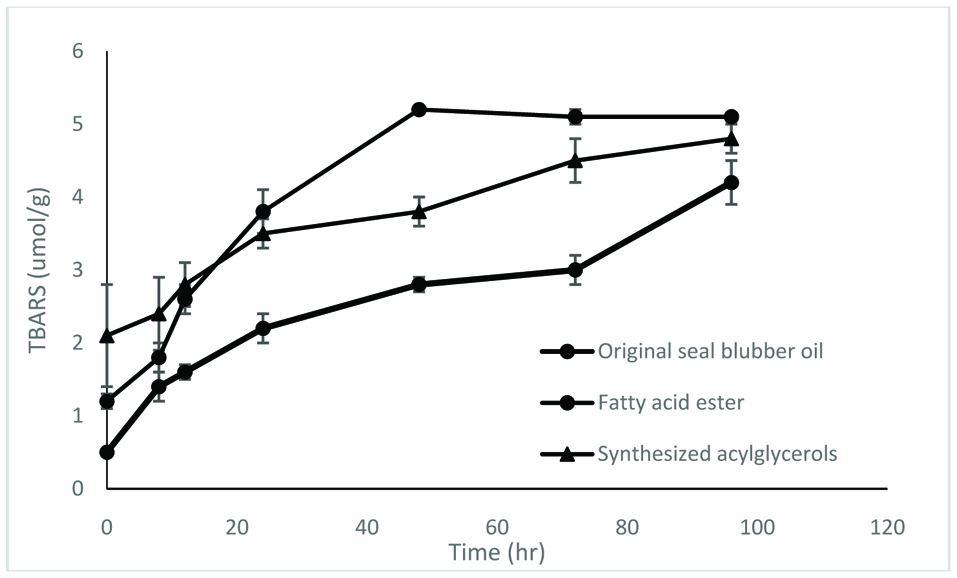
TBARS value of different samples. The test was carried out at 60 °C for 96 hr.
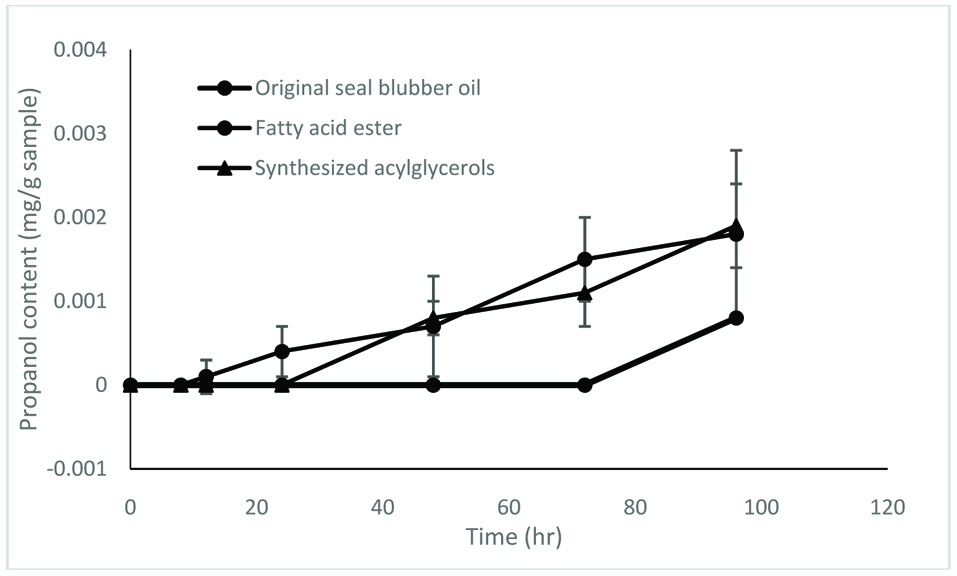
Propanal content of different samples. The test was carried out at 60 °C for 96 hr.
Tables
| Urea to fatty acid ratio | Urea complexed fraction | Non-urea complexed fraction | ||||||
|---|---|---|---|---|---|---|---|---|
| DHA | DPA | EPA | Yield (%) | DHA | DPA | EPA | Yield (%) | |
| 3 | 0.53 | 3.06 | 2.18 | 72 | 37.4 | 7.48 | 26.3 | 20 |
| 3.3 | 0.71 | 3.78 | 3.1 | 72.3 | 40.1 | 4.75 | 25.2 | 18.7 |
| 3.5 | 0.85 | 4.16 | 3.91 | 75 | 44.7 | 3.08 | 23.9 | 16.5 |
| 4.5 | 1.95 | 4.18 | 5.65 | 75 | 50.2 | 2.82 | 18.9 | 12 |
| EPA (%) | DPA (%) | DHA (%) | |
|---|---|---|---|
| Original fatty acids | 7.48±0.22 | 4.03 ± 0.15 | 8.32 ± 0.17 |
| First step concentrates (UCF) | 3.10±0.56 | 3.78 ± 0.32 | 0.71 ± 0.16 |
| Second step concentrates (NUCF) | 20.80±1.58 | 24.00 ± 1.05 | 3.85 ± 0.45 |
| Fatty acids | Original oil (%) | Concentrate (%) |
|---|---|---|
| 16:00 | 7.34 ± 0.38 | 0.15 ± 0.05 |
| 16:1 n-7 | 17.55 ± 1.21 | 18.86 ± 0.90 |
| 18:1 n-9 | 21.62 ± 0.83 | 0.36 ± 0.11 |
| 18:3 n-3 | 0.60± 0.13 | 2.93 ± 0.21 |
| 20:1 n-9 | 12.30 ± 0.32 | 0.10 ± 0.04 |
| 20:5 n-3 | 7.48 ± 0.22 | 20.77 ± 1.58 |
| 22:5 n-3 | 4.03 ± 0.15 | 24.02 ± 1.05 |
| 22:6 n-3 | 8.32 ± 0.17 | 3.85 ± 0.45 |
| Temperature ( °C) | Degree of Synthesis (%) | ||
|---|---|---|---|
| PS30 | IM60 | SP435 | |
| 20 | 26.21 ± 2.83 | 59.10 ± 2.83 | 68.35 ± 1.06 |
| 30 | 51.56 ± 5.39 | 81.12 ± 4.52 | 88.98 ± 1.40 |
| 40 | 52.87 ± 10.79 | 80.86 ± 1.32 | 89.29 ± 0.38 |
| 50 | 62.14 ± 0.81 | 81.89 ± 2.48 | 90.05 ± 1.57 |