Figures
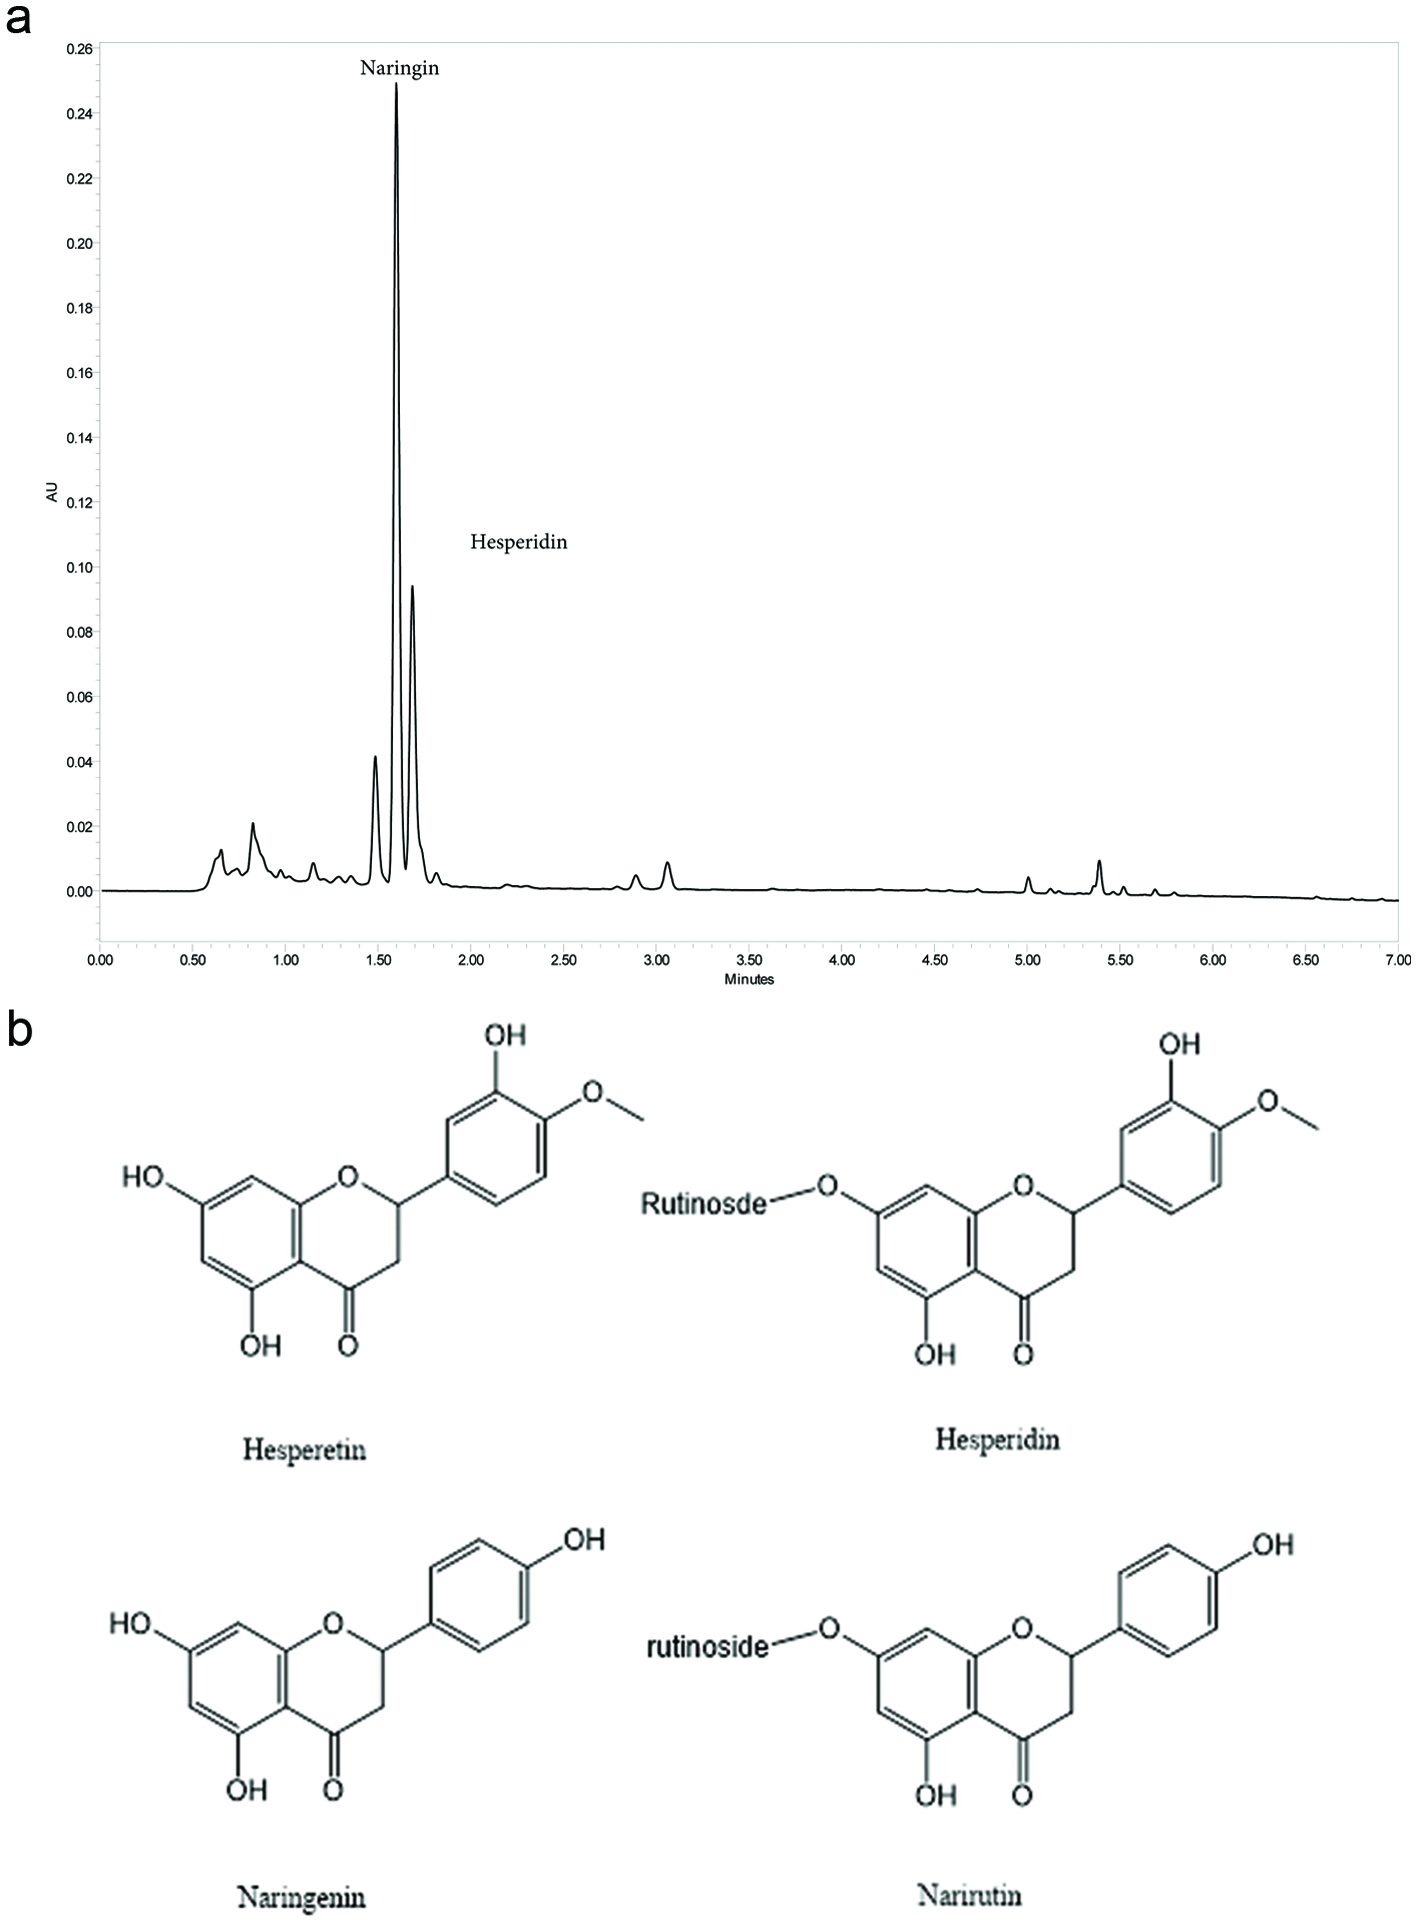
Figure 1. Chemistry of Citrus Bioflavonoid Blend. (a) Representative UHPLC Chromatogram of Proprietary Citrus bioflavonoid blend Extract at 280 nm. Major component peaks identified and labeled as Hesperidin and Naringin. (b) Structures of hesperetin, hesperidin, naringenin and narirutin.
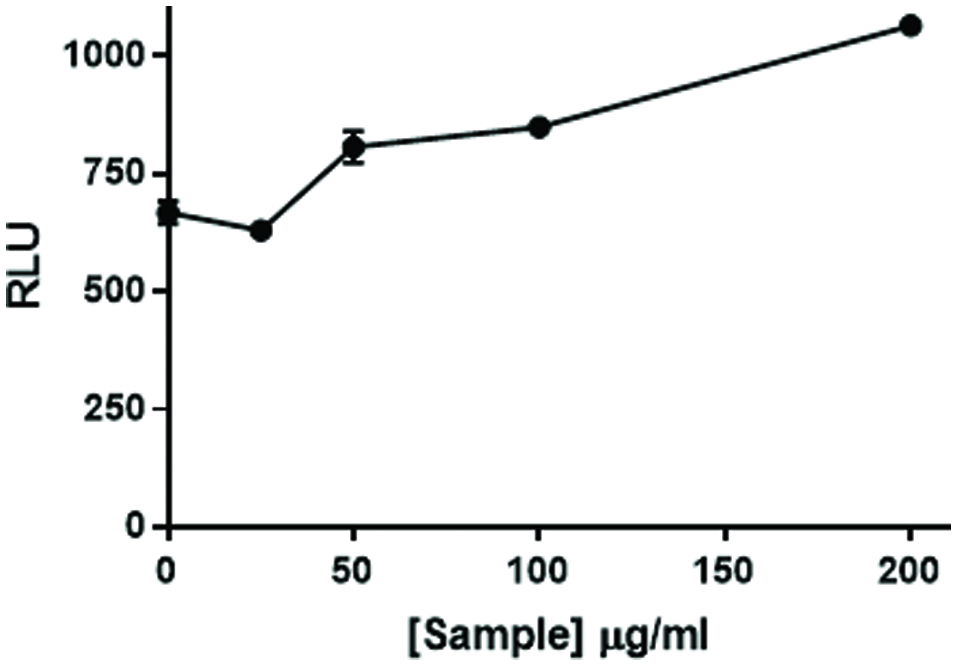
Figure 2. Citrus bioflavonoid blend flavonoid mixture augments NFκB activation. NF49 cells stably transfected with an NFκB response element-luciferase construct were treated with increasing levels of a mixture of citrus flavonoids prior to NFκB activation with imiquimod and human IL-1β (50 pg/mL). The cells were incubated for 6 hr. at which time luciferase activity was measured on a Spectramax M5 plate reader. Data from a representative experiment are expressed as RLU compared to positive control cells treated with IMQD and IL-1β only.
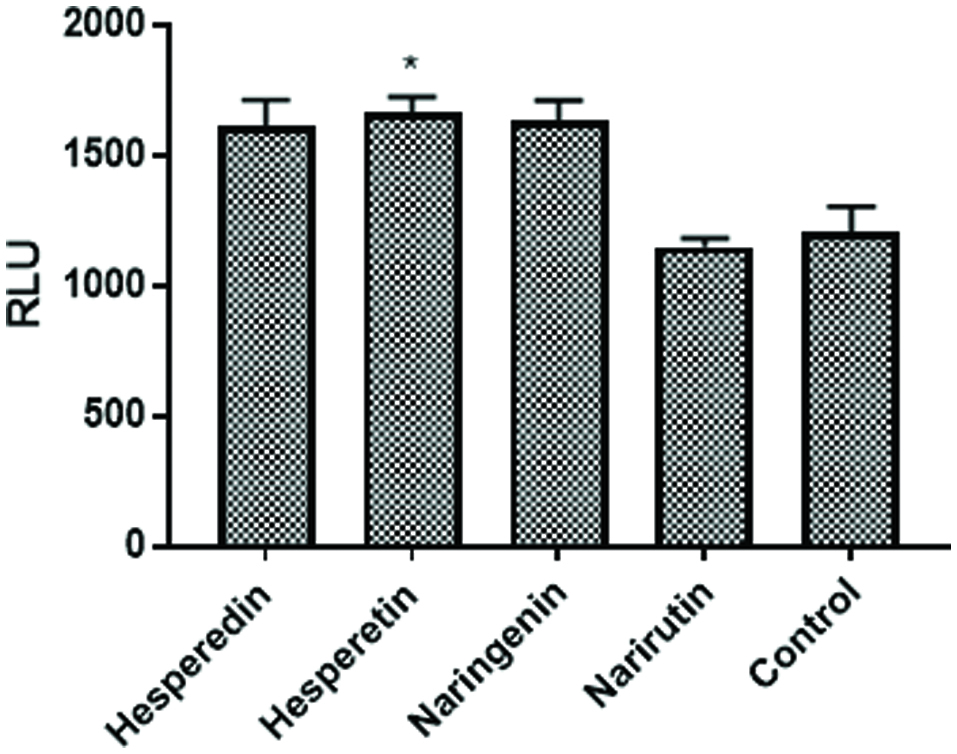
Figure 3. Individual Flavonoids augment NFκB activation. NF49 cells were treated with flavonoids (20 μM) know to be present in the citrus mixture prior to NFκB activation with IMQD and human IL-1β (50 pg/mL). The cells were incubated for 6 hr. at which time luciferase activity was measured on a Spectramax M5 plate reader. Data from a representative experiment are expressed as RLU compared to positive control cells treated with IMQD and IL-1β only.
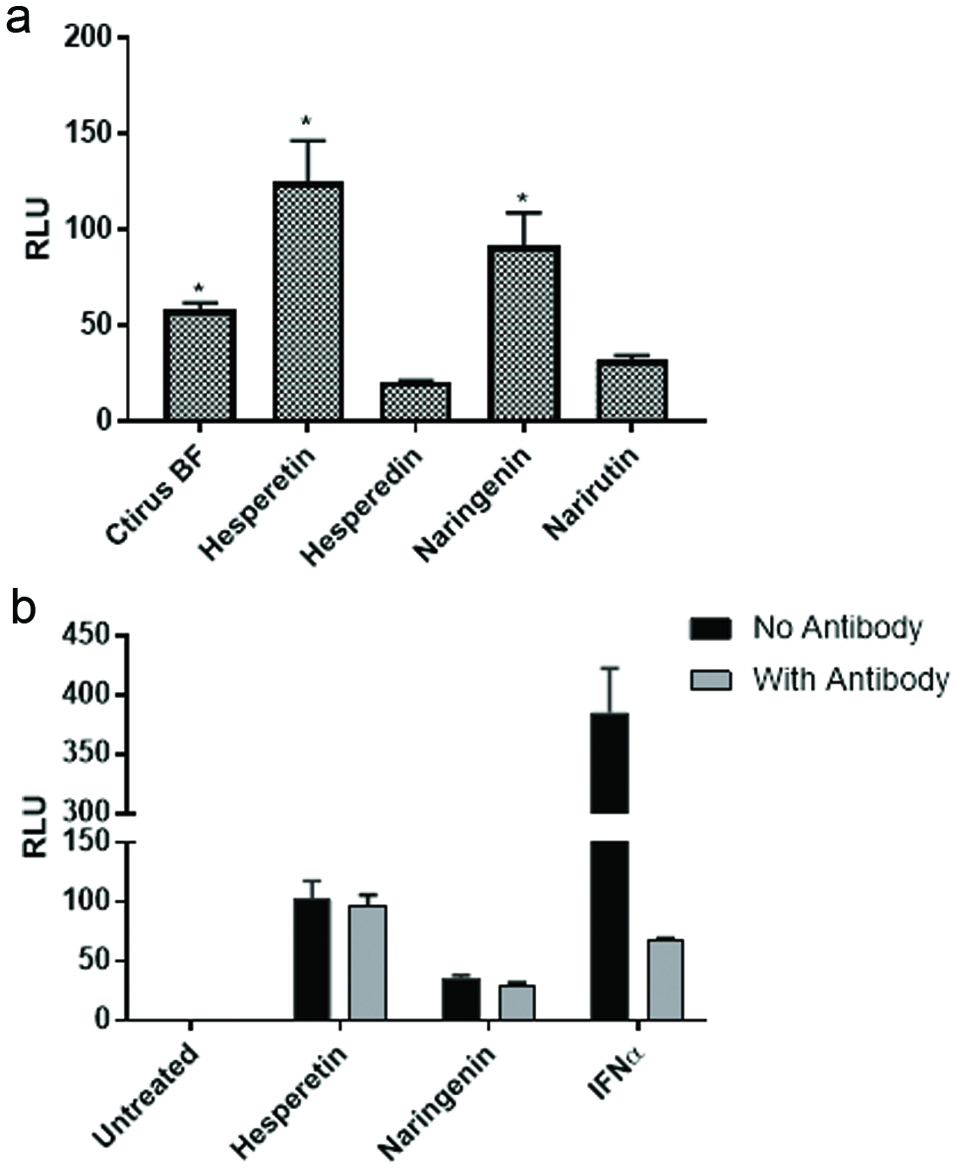
Figure 4. Aglycones but not glycosides activate the ISRE. (a) U2OS cells stably transfected with an ISRE-luciferase plasmid were treated with flavonoids (20 μM) known to be present in the citrus mixture. The cells were incubated for 18 hr. at which time luciferase activity was measured on a Spectramax M5 plate reader. Data from triplicate wells are expressed as RLU compared to untreated negative control cells. (b) U2OS cells stably transfected with an ISRE-luciferase plasmid were treated with flavonoids (20 μM) in the presence or absence of anti-IFNα antibody. Recombinant human universal type I IFN was used as a positive control. Data from triplicate wells are expressed as RLU compared to untreated negative control cells.
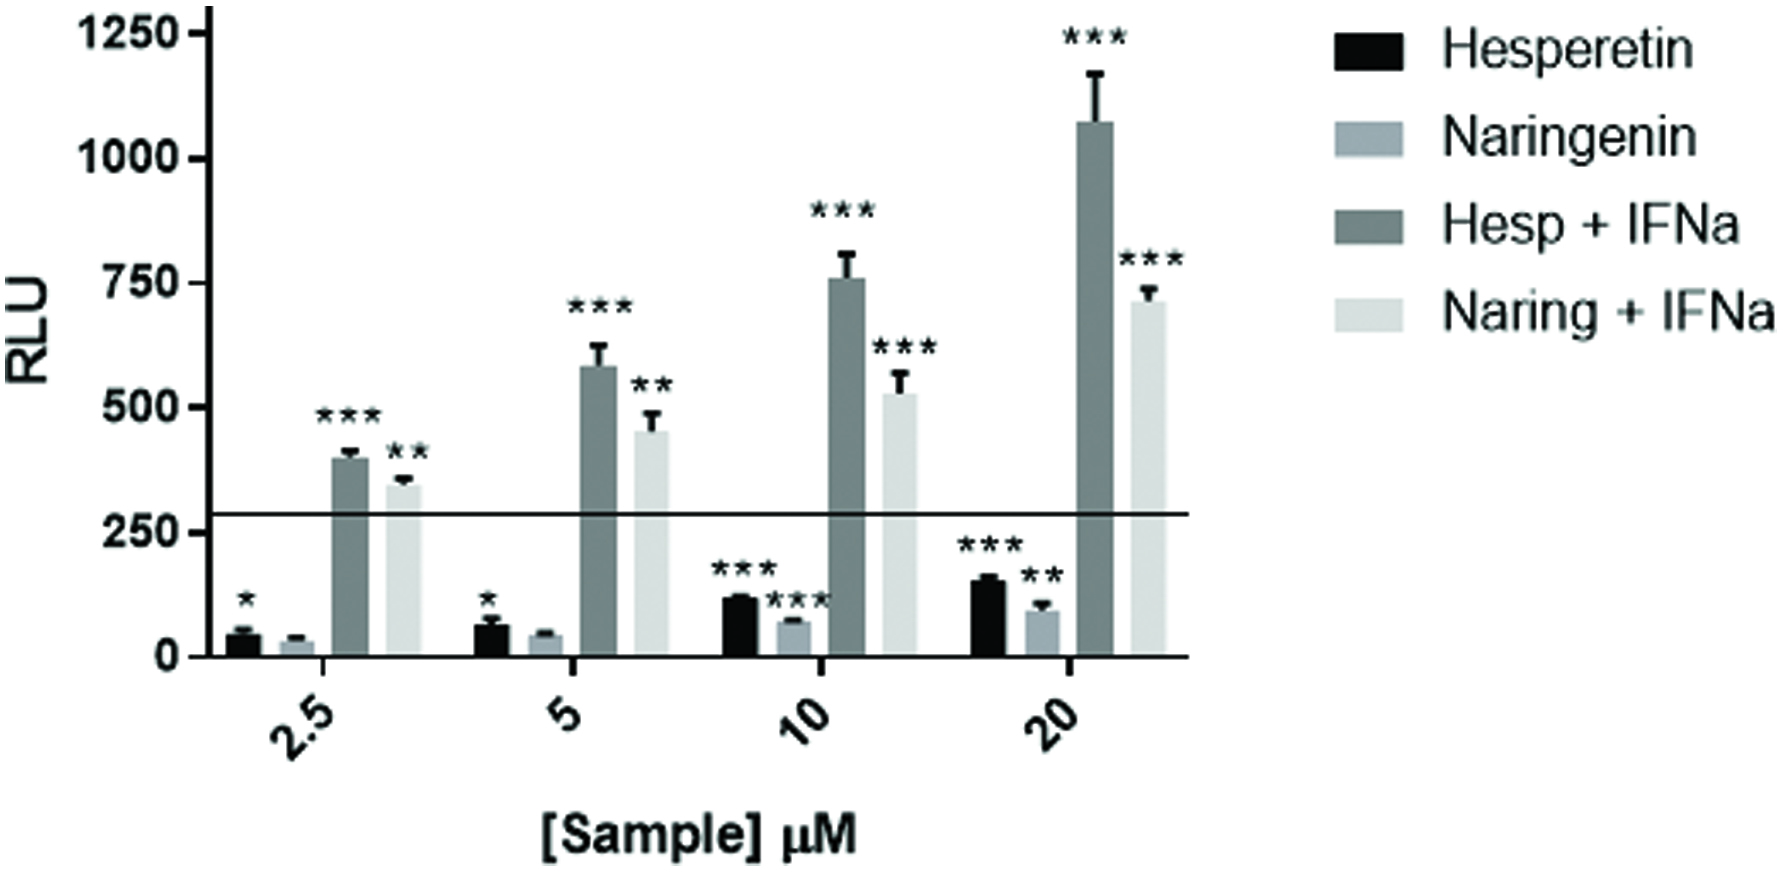
Figure 5. Flavonoids augment ISRE response to IFNα. U2OS cells stably transfected with an ISRE-luciferase plasmid were treated with hesperetin and naringenin at the concentrations shown and with IFNα at 200 IU/mL. The cells were incubated for 18 hr. at which time luciferase activity was measured on a Spectramax M5 plate reader. Data from triplicate wells are expressed as RLU compared to untreated negative control cells. Recombinant human universal type I IFN was used as a positive control. Data from triplicate wells are expressed as RLU compared to untreated negative control cells.
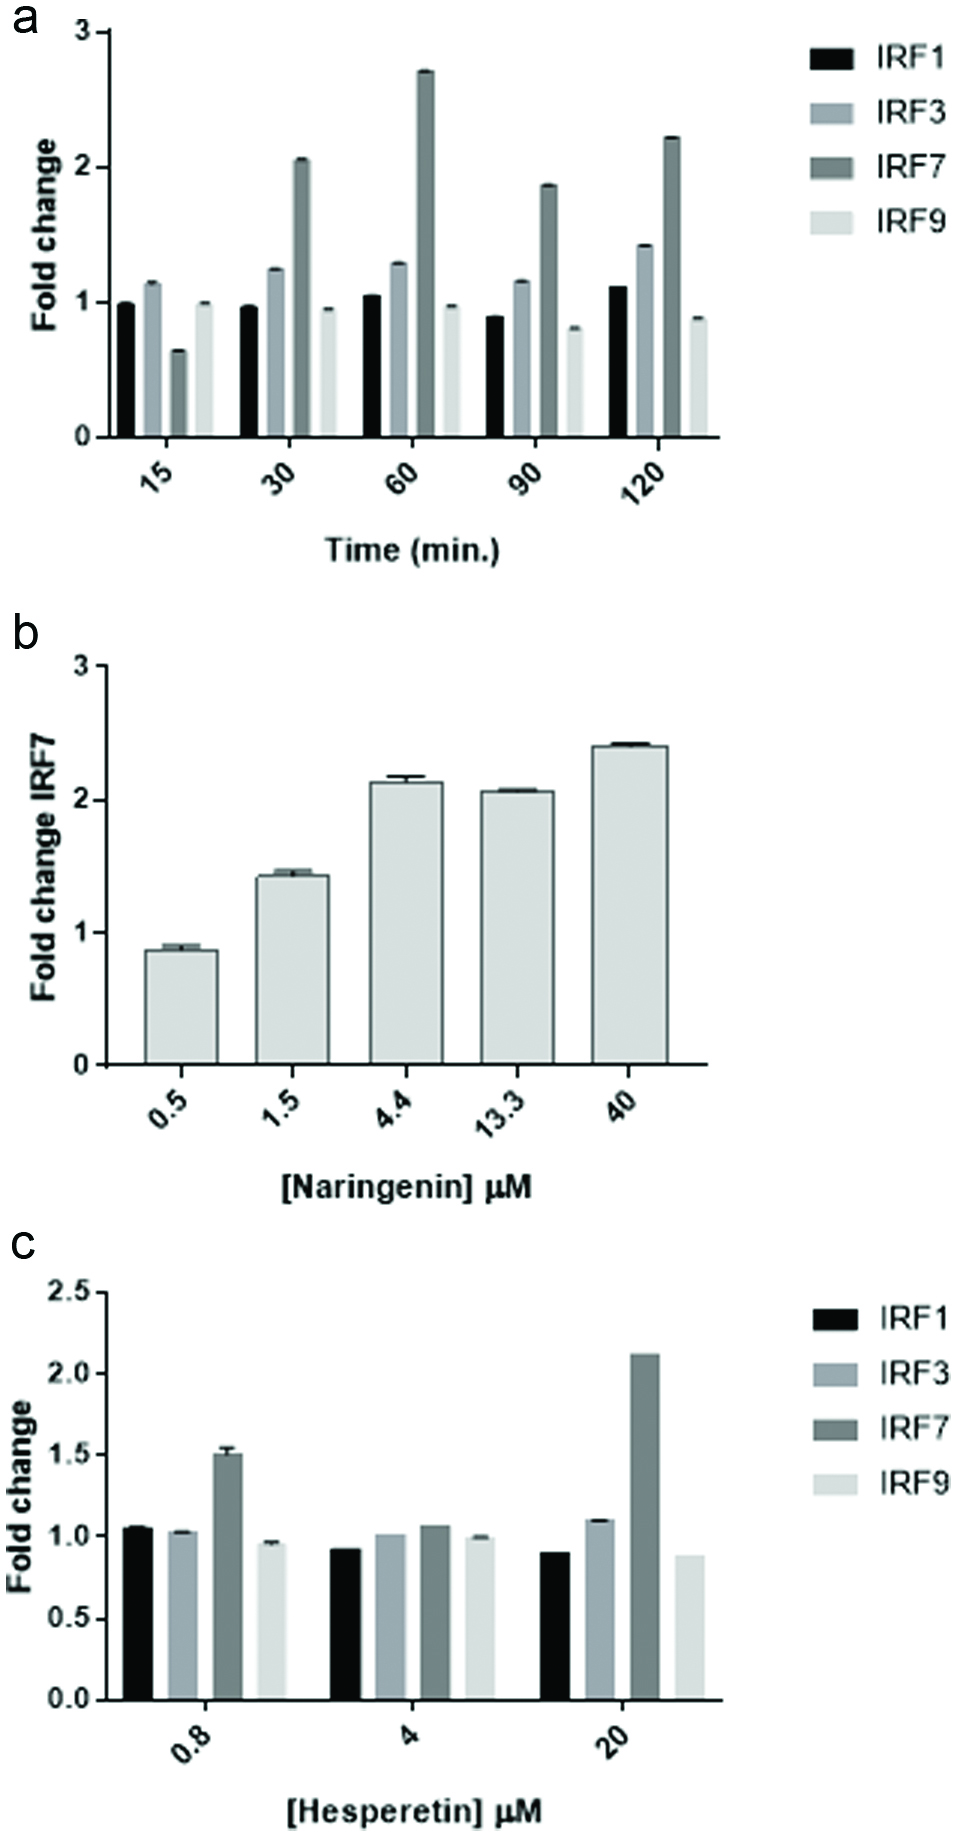
Figure 6. Naringenin and hesperetin stimulate IRF7 gene expression. (a) Time course of IRF expression following treatment of cells with naringenin. U2OS cells were treated with naringenin (20 μM) for the lengths of time indicated. RNA was collected using Qiagen RNEasy columns and 2 step PCR was performed using BioRad iScript and Evagreen SsoFast reagents and primers for IRF1, IRF3, IRF7, and IRF9. Data from quadruplicate wells are expressed as mean fold change ± SD compared to actin as a reference gene. (b) Dose response of IRF7 expression in cells treated with naringenin. U2OS cells were exposed to naringenin at the concentrations indicated for 1 hr. and expression of IRF7 was assessed by PCR as described above. Data from quadruplicate wells are expressed as mean fold change ± SD compared to actin as a reference gene. (c) Dose response of IRF expression in cells treated with hesperetin. U2OS cells were exposed to hesperetin at the concentrations indicated for 1 hr. and expression of IRF7 was assessed by PCR as described above. Data from quadruplicate wells are expressed as mean fold change ± SD compared to actin as a reference gene.
Table
Table 1. Instrument Conditions
| Time (min.) | Mobile Phase Gradient: |
|---|
| A: 0.2% OPA | B: MeOH | C:CAN |
|---|
| Column: Waters UPLC HSS T3, Length: 100 mm, ID: 2.1 mm, 1.8 µm particle size; Flow Rate: 0.33 mL/min; Column Temperature: 25 °C; Sample Vial Temp: 20 °C; Injection Volume: 0.7 μL; Detection Wavelength: 280 nm ; Seal Wash: 90/10 v/v DI Water/ACN; Needle Wash: ACN; Needle Purge: MeOH; Run Time: 10 minutes. |
| 0 | 60% | 25% | 15% |
| 3.2 | 45% | 35% | 20% |
| 4.8 | 20% | 40% | 40% |
| 5.8 | 10% | 45% | 45% |
| 5.81 | 0% | 50% | 50% |
| 7 | 0% | 50% | 50% |
| 7.01 | 60% | 25% | 15% |
| 10 | 60% | 25% | 15% |