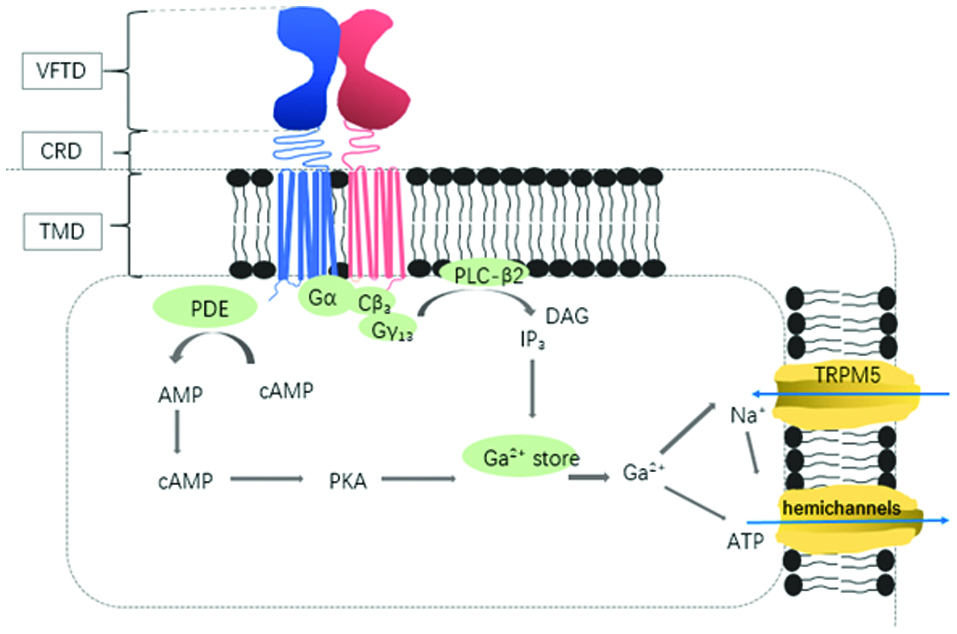
Figure 1.
Signal transduction cascade of sweet receptors.
| Journal of Food Bioactives, ISSN 2637-8752 print, 2637-8779 online |
| Journal website www.isnff-jfb.com |
Review
Volume 4, Number , December 2018, pages 107-116
The effects of sweeteners and sweetness enhancers on obesity and diabetes: a review
Figures
Signal transduction cascade of sweet receptors.
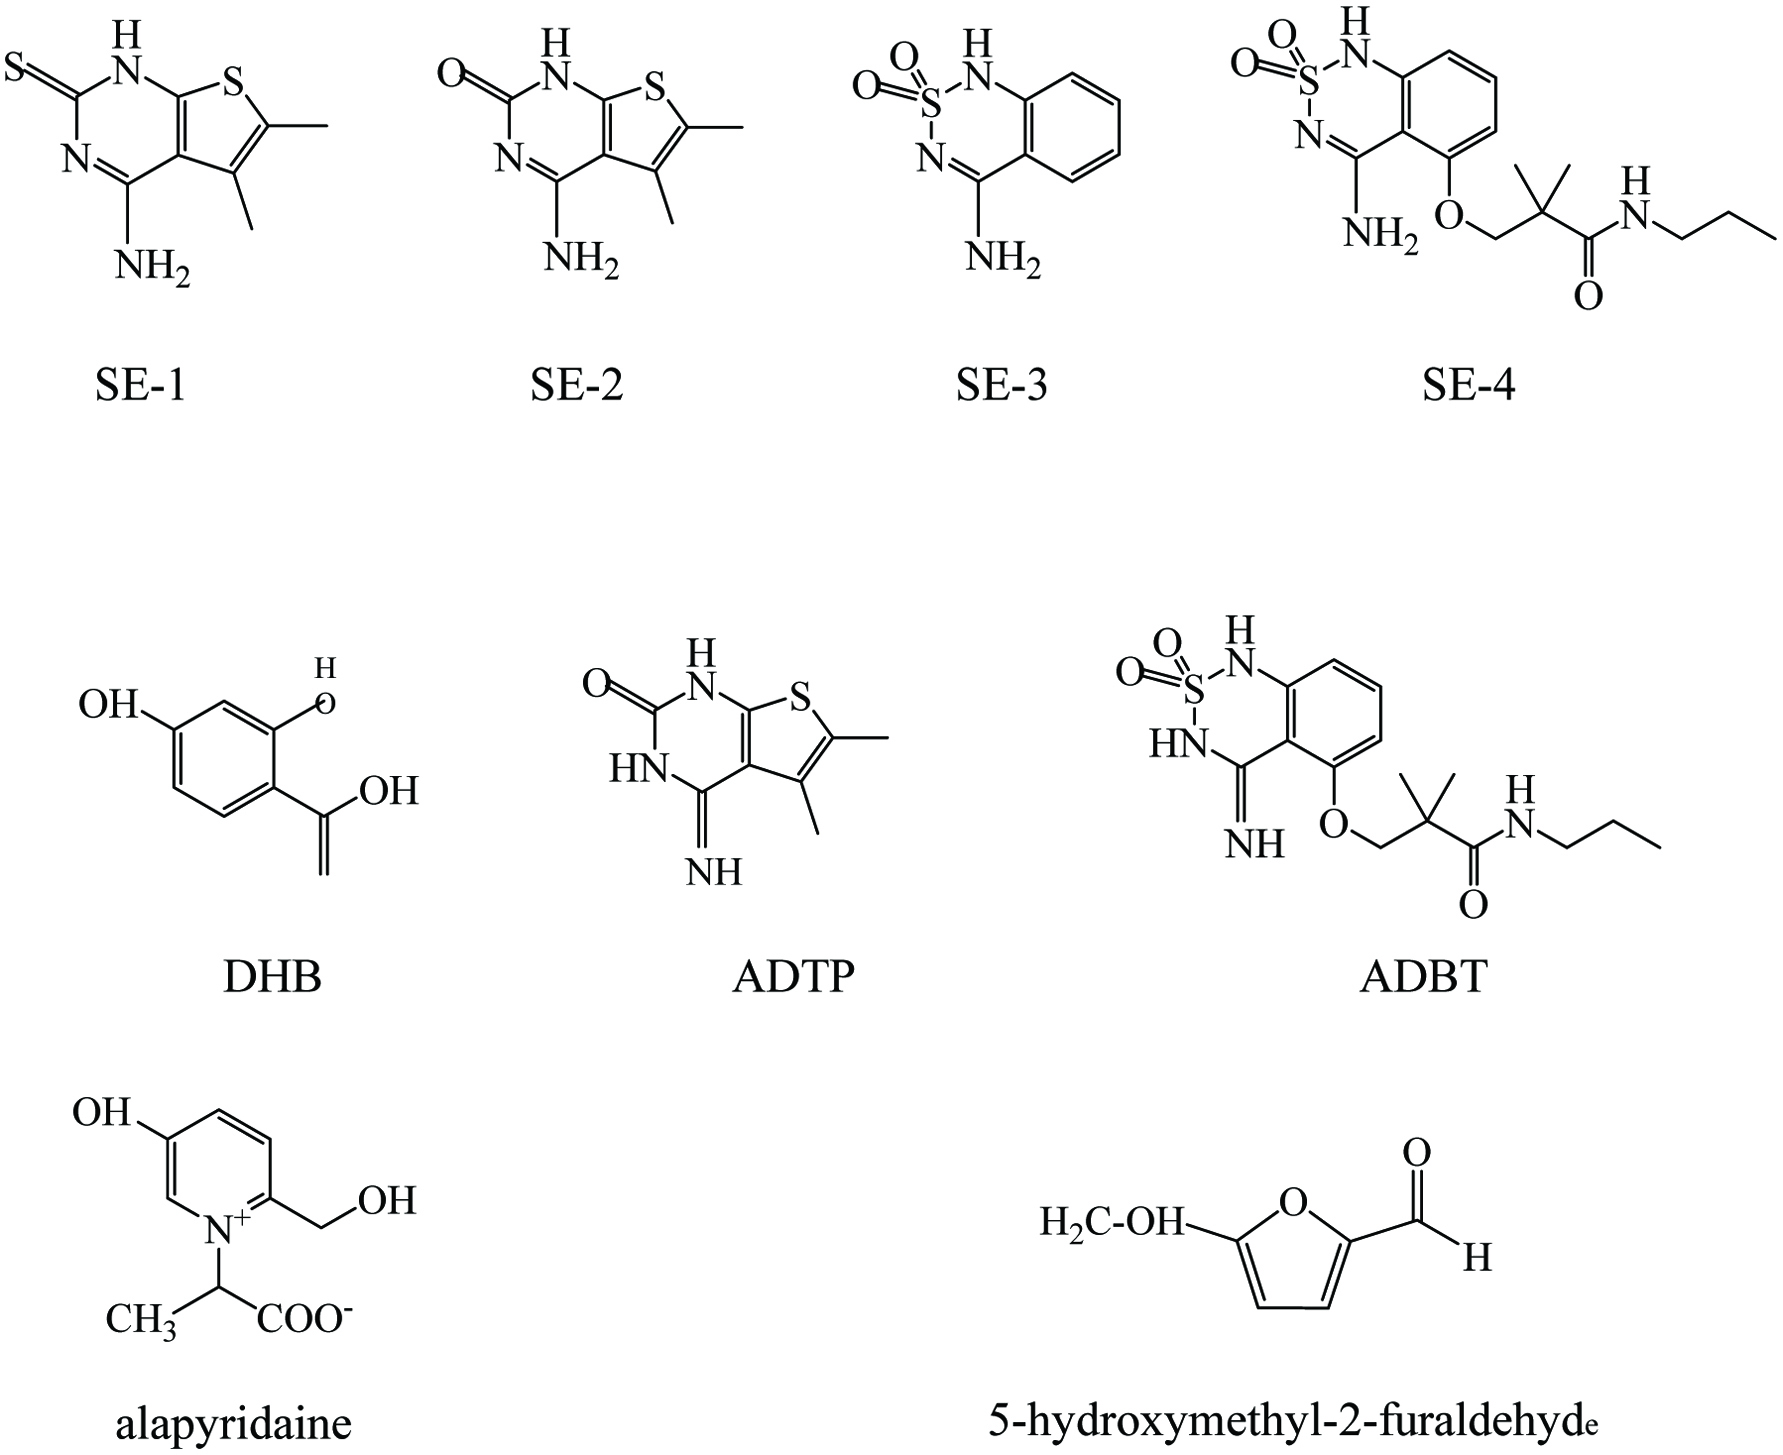
Chemical structure of the non-volatile sweetness enhancers. DHB: 2,4-dihydroxybenzoic acid; ADTP: 4-amino-5,6-dimethylthieno(2,3-D) pyrimidin-2(1H)-one; ADBT: 3-(4-amino-2, 2-dioxido-1H-2,1,3- benzothiadiazin-5-yloxy)-2,2-dimethyl-N-propylpropanamide.
Table
| Compound class | Compound name | Sweetness potency | Reference |
|---|---|---|---|
| Sweetness potency is given relative to sucrose on a weight comparison | |||
| Disaccharides | Sucrose | 1.0 | DuBois (2016) |
| Monosaccharide | Glucose | 0.6 | |
| L-Fructose | 0.6 | ||
| D-Fructose | 1.27 | ||
| D-allulose | 0.7 | Mooradian et al. (2017) | |
| D-tagatose | 0.92 | ||
| D-sorbose | 0.7 | ||
| D-allose | 0.8 | ||
| Sugar alcohol | Erythritol | 0.6–0.8 | Grembecka (2015) |
| Isomalt | 0.45–0.65 | ||
| Lactitol | 0.3–0.4 | ||
| Maltitol | 0.9 | ||
| Mannitol | 0.5–0.7 | ||
| Sorbitol | 0.5–0.7 | ||
| Xylitol | 1.0 | ||
| Artificial and natural sweeteners | Acesulfame-K | 100–200 | Beltrami et al. (2018); Mooradian et al. (2017) |
| Advantame | 20,000–40,000 | ||
| Aspartame | 100–200 | ||
| Cyclamate | ∼30 | ||
| Neohesperidin dihydrochalchone | 250–2,000 | ||
| Neotame | 7,000–13,000 | ||
| Saccharin | 300–500 | ||
| Sucralose | ∼600 | ||
| Stevioside | 210 | ||
| rebaudioside | 30–242 | ||
| Mogroside IV | 233–292 | ||
| Mogroside V | 250–425 | ||
| Proteins | Brazzein | 500–2,000 | Behrens et al. (2011); Beltrami et al. ( 2018) |
| Curculin (neoculin) | 550–9,000 | ||
| Mabinlin | 375 | ||
| Monellin | 3,000 | ||
| Pentadin | 500 | ||
| Thaumatin | 1,600–10,000 | ||