Journal of Food Bioactives, ISSN 2637-8752 print, 2637-8779 online
Journal website www.isnff-jfb.com

Opinion

Volume 5, March 2019, pages 1-5


Profiled tea extracts exemplifying the importance of characterizing food bioactives: opinion piece

Figures

Figure 1.
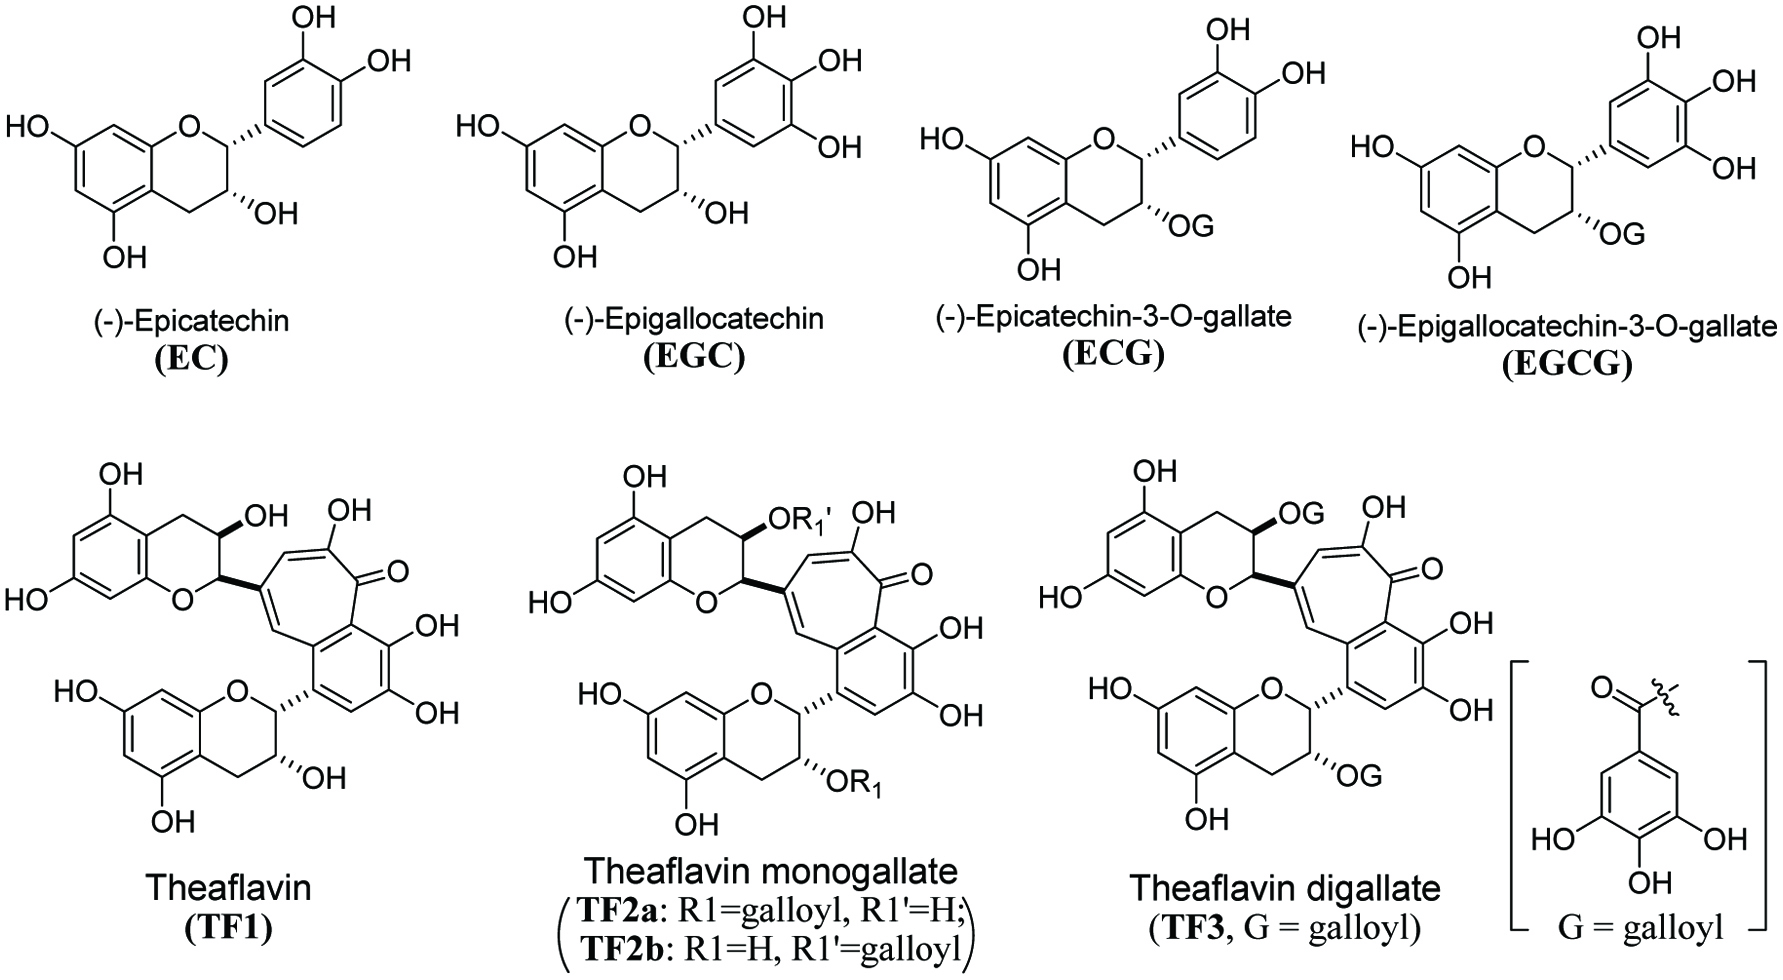
Figure 1. Main catechins in green tea and major theaflavins in black tea.
Figure 2.
Figure 2. Tea polyphenol profile of 70% GTE. (EGC-10.8 min, 10.0%; EC-18.5 min, 3.9%; EGCG-20.2 min, 32.8%; and ECG-34.2 min, 24.6%. Concentration: 1 mg/ml aquous solution. Analysis conditions: C18 column, 4.6x150 mm, 3 µm, 100 Å, UV 280 nm. Mobile phase: water( 0.1% HOAc and acetonitrile).
Figure 3.
Figure 3. Tea polyphenol profile of 70% BTE. (BTE, 40% theaflavin, 3 mg/ml solution. Peak 1. caffeine; Peak 2. EGCG; Peak 3. ECG; Peak 4. TF1; Peak 5. TF2a; Peak 6. TF2b; Peak 7. TF3. Analysis conditions: C18 column, 4.6x150 mm, 3 µm, 100 Å, UV 280 nm, Mobile phase: water (0.1% HOAc) and acetonitrile).