| Journal of Food Bioactives, ISSN 2637-8752 print, 2637-8779 online |
| Journal website www.isnff-jfb.com |
Original Research
Volume 3, September 2018, pages 124-132
α-Glucosidase inhibitory activities, functional properties, and safety of green tea polysaccharides as a potential source of dietary supplement
Ayse Karadaga, Kubra Dogana, Ebru Pelvanb, Arzu Tasc, Ozlem Atli Eklioglud, Soner Aksuc, Cesarettin Alasalvarb, *
aDepartment of Food Engineering, Yıldız Technical University, 34210, Esenler-İstanbul, Turkey
bTÜBİTAK Marmara Research Center, Food Institute, P.O Box 21, 41470 Gebze-Kocaeli, Turkey
cTÜBİTAK Marmara Research Center, Genetic Engineering and Biotechnology Institute, P.O Box 21, 41470 Gebze-Kocaeli, Turkey
dDepartment of Pharmaceutical Toxicology, Faculty of Pharmacy, Anadolu University, 26470 Tepebaşı-Eskişehir, Turkey
*Corresponding author: Cesarettin Alasalvar, TÜBİTAK Marmara Research Center, Food Institute, P.O Box 21, 41470 Gebze-Kocaeli, Turkey
DOI: 10.31665/JFB.2018.3155
Received: July 11, 2018; Revised received & accepted: September 4, 2018
| Abstract | ▴Top |
Procuring valuable bioactive compounds from low quality green tea is of great interest. Green tea polysaccharides (GTPS), obtained from low quality tea leaves, were examined for their yield, monosaccharide composition, total phenolic content, antioxidant potential, and structures as well as molecular weight distribution and in vitro anti-diabetic activities. GTPS were also evaluated for their toxicity by performing cytotoxicity and genotoxicity. Additionally, 50% lethal dose (LD50) for GTPS was determined using an acute toxicity test to assess the safe use of it as a dietary supplement. Monosaccharides of GTPS were mainly composed of xylose, glucose, ribose, galactose, arabinose, and glucuronic acid. GTPS exhibited 91.86% α-glucosidase inhibition at 0.5 mg/mL concentration. The α-glucosidase inhibitory activity of GTPS was higher than that of pharmacological glucosidase inhibitor, acarbose, which exhibited only 47.86% inhibition at 2.5 mg/mL concentration. Neither cytotoxic nor no mutagenic effects were found for GTPS. The acute toxicity also showed that LD50 of GTPS was greater than 5,000 mg/kg. The present work suggests that GTPS can be considered as an anti-diabetic dietary supplement without posing any potential health risk.
Keywords: Green tea polysaccharide (GTPS); Anti-diabetic; α-Glucosidase inhibition; Toxicity tests; LD50 value; Dietary supplement
| 1. Introduction | ▴Top |
Diabetes mellitus (DM) has become one of the biggest public health challenges for the 21st century around the world and type II diabetes is the most common form which accounts for 90–95% of all diabetes cases. Exploration of novel safe and effective bioactive compounds with anti-diabetic activity has become an important research focus due to the serious adverse effects associated with the oral synthetic hypoglycemic agents (Shori, 2015; Wang and Zhu, 2016).
Tea is one of the most popular beverages around the globe. The majority of research has recently been concentrated on the understanding of the molecular characterization and bioactivities of complex tea polyphenols. Over the last decade, tea polysaccharides have also attracted scientific interest due to their anti-diabetic effects (Chen et al., 2016; Nie and Xie, 2011; Xiao and Jiang, 2015).
Turkey is the fifth largest producer of tea, with a production of 221,600 metric tonnes (Alasalvar et al., 2013). The products present in Turkish market are loose tea, tea bag, and flavoured tea. Therefore, an alternative use of tea as raw material for dietary supplement is of great interest for both producers and consumers. Although an increasing number of studies indicate the possible anti-diabetic activity of tea polysaccharides, there is limited information available in the literature about their potential toxicity. The aims of this study were to examine the physico-chemical characteristics, functional properties, and in vitro anti-diabetic activities of green tea polysaccharides (GTPS) and to assess their toxicity using various assays (including an acute toxicity) to facilitate their potential use as a source of dietary supplement.
| 2. Materials and methods | ▴Top |
2.1. Samples and reagents
Green tea samples (Antik Yeşil I) were procured from ÇAYKUR (State-Owned Tea Enterprise, Rize, Turkey). All chemical reagents were obtained from Sigma-Aldrich Co. Ltd. (Dorset, UK), unless otherwise stated.
2.2. Extraction of GTPS and determination of yield
Green tea was mixed with 80% ethanol (1:10; w/v) and allowed to stand overnight to remove most of the polyphenols, monosaccharides, and low-molecular-weight impurities. After filtration, tea leaves were air-dried and submitted to hot-water extraction with a extraction time of 120 min, at a temperature of 80 °C, and ratio of water to tea leaves of 1:20 (m/v). After extraction, solutions were centrifuged at 5,870 g for 10 min and the supernatant was filtered through a filter paper (Whatman, grade 4, pore size 20–25 µm; Fisher Scientific, Loughborough, UK). The filtrate was collected and concentrated to 1/4 of the original volume with a rotary evaporator at 50 °C under vacuum. The filtrate was subsequently mixed with four volumes of ethanol and kept at 4 °C overnight. The precipitates were obtained by centrifugation at 15,000 g for 20 min at chill temperature (4 °C), and the pellet was washed with acetone and ethanol, solubilized in water, applied to reagent (butanol/ chloroform, v/v; 1:4), to remove proteins. The aqueous phase was dialyzed against distilled water for a day and lyophilized to obtain crude GTPS powder. The percentage yield of crude polysaccharide (Y) was calculated as follows:
2.3. Characterization of GTPS
2.3.1. Determination of chemical composition
Total carbohydrate was determined by the phenol–sulphuric acid method with D-glucose as a standard (DuBois et al., 1956; Xi et al., 2010). The soluble protein was determined by the method of Bradford (1976), using bovine serum albumin as a standard. The uronic acid content was determined by employing the m-hydroxylbiphenyl method described by Blumenkrantz and Asboe-Hansen (1973) and using galacturonic acid as a standard.
2.3.2. Determination of total phenolic content
The content of total phenolics was determined according to the procedure described by Horszwald and Andlauer (2011), using the Folin—Ciocalteu phenol reagent. The content of total phenolics was calculated from a standard curve of gallic acid and expressed as grams of gallic acid equivalents (GAE) per 100 g of sample.
2.3.3. Determination of antioxidant activities
The two methods described by Cheng et al. (2013) were used to assess the 2,2′-azino-bis (3-ethylbenzothiazoline-6-sulphonic acid) (ABTS) radical scavenging activity and ferric reducing antioxidant potential (FRAP). Each sample was dissolved in water and the results were expressed as milligrams of trolox equivalents (TE) per 100 milligrams of sample for ABTS assay and mg of FeSO4·7H2O equivalents per 100 mg sample for FRAP assay.
2.3.4. Determination of molecular weight
The method described by Cai et al. (2013) was used to assess the molecular weight of the samples. Briefly, a high performance liquid chromatography (HPLC) system (LC-20AD pump, SPDM20A DAD detector, SIL-20A HT autosampler, CTO-2OAC column oven, DGU-20A5 degasser, and CMB-20A communications bus module; Shimadzu Corp., Kyoto, Japan) was used with a column (Ultrahydrogel Linear 7.8 × 300 mm; Waters Corp., Milford, MA, USA) and a guard column (Ultrahydrogel, 6 × 40 mm). The samples were dissolved (10 mg/mL) in the mobile phase solution and passed through a 0.45 µm filter. The detailed conditions were as follows: mobile phase (0.1 M NaNO3), flow rate (1 mL/min), column temperature (45 °C), and injection volume (10 µL). Dextrans of different weights from Sigma were used as calibration standards (molecular weight: 1,000, 5,000, 12,000, 25,000, 50,000, 80,000, 150,000, 270,000, 410,000, and 670,000 Da).
2.3.5. Determination of monosaccharides
The method described by Dai et al. (2010) was used to assess the monosaccharide composition of each sample. After hydrolysis of polysaccharides and derivatization of monosaccharides with 1-phenyl-3-methyl-5-pyrazolone (PMP), a HPLC system (LC-20AD pump, SPDM20A DAD detector, SIL-20A HT autosampler, CTO-2OAC column oven, DGU-20A5 degasser, and CMB-20A communications bus module; Shimadzu Corp., Kyoto, Japan) was used with a Shiseido column (Capcell Pak C18, 250 mm × 4.6 mm, 5 μm particles; Phenomenex Inc., Macclesfield, UK). The quantitation of monosaccharides was based on the calibration curves built for each of the standard.
2.3.6. Fourier transform-infrared (FT-IR) spectrophotometric analysis
The spectra of the polysaccharides were recorded with FT-IR spectrophotometer (Perkin Elmer Spectrum 400; Waltham, MA, USA). The finely powdered sample was pressed into the sample holder for FT-IR measurement in the frequency range of 4,000–650 cm−1.
2.3.7. Determination of α-glucosidase activity
The effects of extracts on α-glucosidase activity were determined by modifying the method described by Wei et al. (2010), using α-glucosidase from Saccharomyces cerevisiae (Sigma G5003; Sigma-Aldrich Co. Ltd., Dorset, UK). The substrate solution of 4-nitrophenyl α-D-glucopyranoside (NPG) was prepared in 20 mM phosphate buffer with 6.7 mM sodium chloride at pH 6.9. A 75 µL of α-glucosidase (1.0 U/mL) was pre-incubated with 50 µL of the different concentrations of the extracts for 5 min. Then, a 75 µL of 3.0 mM of NPG as a substrate was added to start the reaction. The reaction mixture was incubated at 37 °C for 20 min and subsequently stopped by adding 2 mL of 0.1 M Na2CO3. The α-glucosidase activity was determined by measuring the yellow-coloured p-nitrophenol released from NPG at 405 nm. One unit of α-glucosidase activity was defined as the amount of enzyme required to produce one μmole of p-nitrophenol from NPG (3 mM) in sodium phosphate buffer (20 mM) with 6.7 mM NaCl, pH 6.9 at 37 °C. Percentage inhibition was calculated as follows:
2.3.8. Determination of cytotoxicity
The NIH/3T3 (ATCC® CRL-1658™, mouse embryonic fibroblast), a normal/healthy cell line, was used to assess the in vitro cytotoxicity of GTPS. Cell viability was evaluated by using the [2,3-bis-(2-methoxy-4-nitro-5-sulphophenyl)-2H-tetrazolium- 5-carboxanilide] (XTT) cytotoxicity test kit (Xenometrix AG, Allschwil, Switzerland), as outlined by Altintop et. al. (2012) and Kwiecińska et. al. (2012). Cells were grown in Dulbecco’s Modified Eagle Medium (DMEM) containing fetal bovine serum and penicillin-streptomycin at 37 °C in a 5% CO2 incubator. Cytotoxicity studies were carried out for nine different GTPS concentration (ranged from 5 to 0.019 mg/mL) prepared with sterile water. Growth and solvent controls were run in four replicates. The number of cells added to the wells was 1 × 10⁴ and the incubation time of the GTPS was for 24 hours. At the end of the incubation period, the upper part of the wells was removed and 200 μL of fresh medium was added. After that, 50 μL of XTT II and XTT I mixture (1:100) were added and held for 3 hours incubation. The absorbance values were read at 480 and 690 nm and % inhibition values were calculated for each concentration of GTPS. The inhibitor concentration 50 (IC50) values of the GTPS were calculated. The IC50 values were estimated by plotting a dose response curve of the inhibition (%) versus test compound concentrations.
2.3.9. Determination of genotoxicity
AMES microplate format (MPF) 98/100 mutagenicity assay sample kit (Xenometrix AG, Allschwil, Switzerland) was used to evaluate the genotoxicity of the selected compounds as previously described by Altintop et al. (2012, 2016). Salmonella typhimurium TA98 (frameshift mutations) and TA100 (base-pair substitutions) strains were used. The compounds were tested at the concentrations between 16 and 5,000 μg/mL (5.0, 2.5, 1.25, 0.625, 0.3125, and 0.156 mg/mL in dimethyl sulphoxide in accordance with the guidelines (Chandrasekaran et al., 2011). Mutagenity was tested with/without metabolic activation with Aroclor™-1254 induced male Sprague–Dawley rat liver microsomal enzyme (S9) mix (Xenometrix AG, Allschwil, Switzerland). Growth medium (GM) was added to vials containing Salmonella typhimurium TA98 and TA100 strains. Bacterial suspension and GM were added to the culture tube. Mixture was incubated for 12–16 hours at 37 °C while stirring at 250 rpm. If the OD600 value was greater than 2.5, the experiment procedure was continued. Dilutions of 10 μL were prepared at 6 different concentrations (5, 2.5, 1.25, 0.625, 0.3125, and 0.156 mg/mL) of GTPS. Exposures with TA98 and TA100 bacterial strains with 2-aminoanthracene, which were positive controls in the presence of the S9 enzyme fraction, and 4-nitro-o-quinoline and 2-nitrofluren, in the absence of the S9 enzyme fraction, were performed. Exposure medium, bacterial strains, GTPS, and S9 enzyme fraction were added in exposure plate and incubated for 90 min. At the end of the period, a purple indicator medium was added to each wells and the whole contents were transferred to a 384-plate and incubated at 37 °C for 48 hours. The bacterial metabolism on the plate changed the pH and the purple colour turned to yellow. The average number of positive (yellow) wells based on the applied doses was calculated from triplicate replicates. The results were compared with the baseline (baseline = mean number of positive wells of the zero-dose control ± 1 standard deviation) and the fold changes for each dose was determined.
Fold induction over the solvent control and fold induction over the baseline were calculated as follows: Fold induction over the solvent control was the ratio of the mean number of positive wells for the dose concentration divided by the mean number of positive wells for the zero-dose control. Fold induction over the baseline was the ratio of the mean number of positive wells for the dose concentration divided by zero-dose baseline. If the baseline was less than 1, the value was set to 1 for calculation. All doses were compared according to student’s t-test at P < 0.05 for statistical significance.
Assessment criteria of cultures have been determined based on high and low growth rates (Flückiger-Isler and Kamber, 2012). The same test design was repeated by adding the S9 liver microsomal enzyme fraction (Xenometrix AG, Allschwil, Switzerland) obtained from rat liver, to identify the mutagenesis of GTPS in the case of metabolic activator presence. Mutagenicity of compounds was identified according to the evaluation criteria given in Table 1.
 Click to view | Table 1. Mutagenicity of compounds identified according to the evaluation criteria |
2.3.10. Determination of lethal dose 50 (LD50)
The LD50 assay was performed for GTPS according to the protocol “OECD 423-Acute Oral Toxicity (acute toxicity classification method)” which was applied as a conventional acute toxicity test. The LD50 value of the GTPS was determined by applying the limit test protocol as specified in Annex 3 of the OECD 423 test protocol (Figure 1). The method was carried out as described by Jiang and Zhen (2004). According to the test procedure, the 8–12 weeks old 3 CD1 female mice housed in the animal facility of Genetic Engineering and Biotechnology Institute of TÜBİTAK MAM. For in vivo study, ethics was approved by the animal ethics committee of the TÜBİTAK MAM (Gebze-Kocaeli, Turkey).
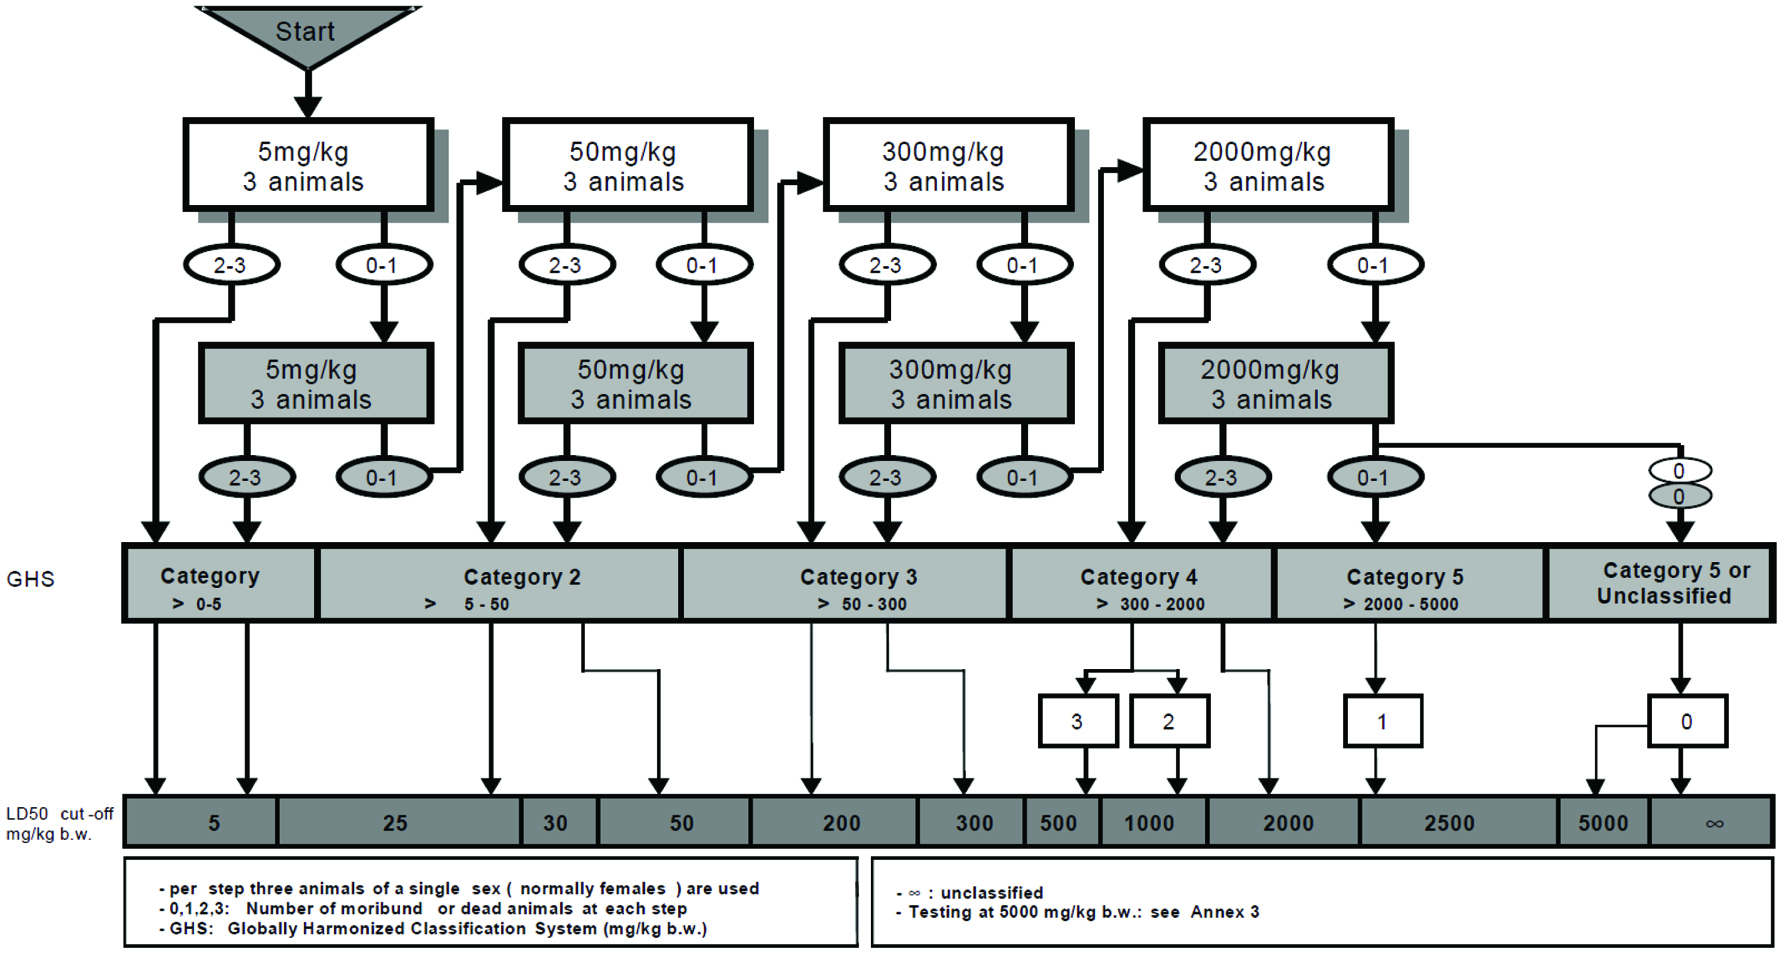 Click for large image | Figure 1. Limit test procedure. |
2.4. Statistical analysis
Differences were considered to be significant at P ≤ 0.05. Differences for analyses were estimated by analysis of variance (ANOVA). Statistical analyses were performed using the SPSS 18.0 version (SPSS Inc., Chicago, IL).
| 3. Results and discussion | ▴Top |
3.1. Compositional characteristics and antioxidant activities of GTPS
The yield, compositions, and antioxidant activities of GTPS are given in Table 2. The yield of crude polysaccharides was 3.05%, similar to those found by Cai et al. (2013) and Chen et al. (2009). The uronic acid and neutral sugar content of GTPS were 15.11 and 34.33%, respectively. GTPS was a protein bounded polysaccharide and, therefore, its protein content was 2.21%. The monosaccharide composition of GTPS was mainly composed of galactose, arabinose, and glucose with the presence of some glucuronic and galacturonic acids. The latter two were acidic heteropolysaccharide. Our results are similar to the studies in the literature showing that tea polysaccharides have arabinogalactan structures (Chen et al., 2009; Scoparo et al., 2016).
Click to view | Table 2. Yields, compositional characteristics, and antioxidant activities of green tea polysaccharides |
Total phenolic content and antioxidant activities, using two different assays, were also determined (Table 2). Total phenolic content of GTPS was 5.80 g GAE/100 g sample. Wang et al. (2013) revealed that tea polyphenols are the major antioxidant in the crude tea polysaccharide and when only polysaccharide fractions isolated from crude polysaccharide extract, these fractions showed low antioxidant activity. Similar to their observation, GTPS in the present study showed low antioxidant activities when evaluated by FRAP and ABTS assays (Table 2).
3.2. Molecular weight distribution
The molecular weight distributions and peak pattern of GTPS are illustrated in Figure 2. Weight-average molecular weight (Mw) value, calculated by the regression equation [log (Mw) = −0.081x3 + 2.215x2 − 20.965x + 72.956; R2 = 0.998, were obtained by dextran standards and retention time]. GTPS contained three peaks and predominant component (81.48%) was eluted at a retention time of 10.27 min with a Mw value of 2.07 kDa. The minor fractions eluted at a retention time of 7.89 min (9.96 %) and 11.60 (8.55%) had Mw of 1,409 and 9 kDa, respectively. Chen et al. (2016) reviewed that the Mw of tea polysaccharides ranged from 1.2 to 3,900 kDa and explained that the differences may have resulted from raw material, extraction, as well as separation and determination methods.
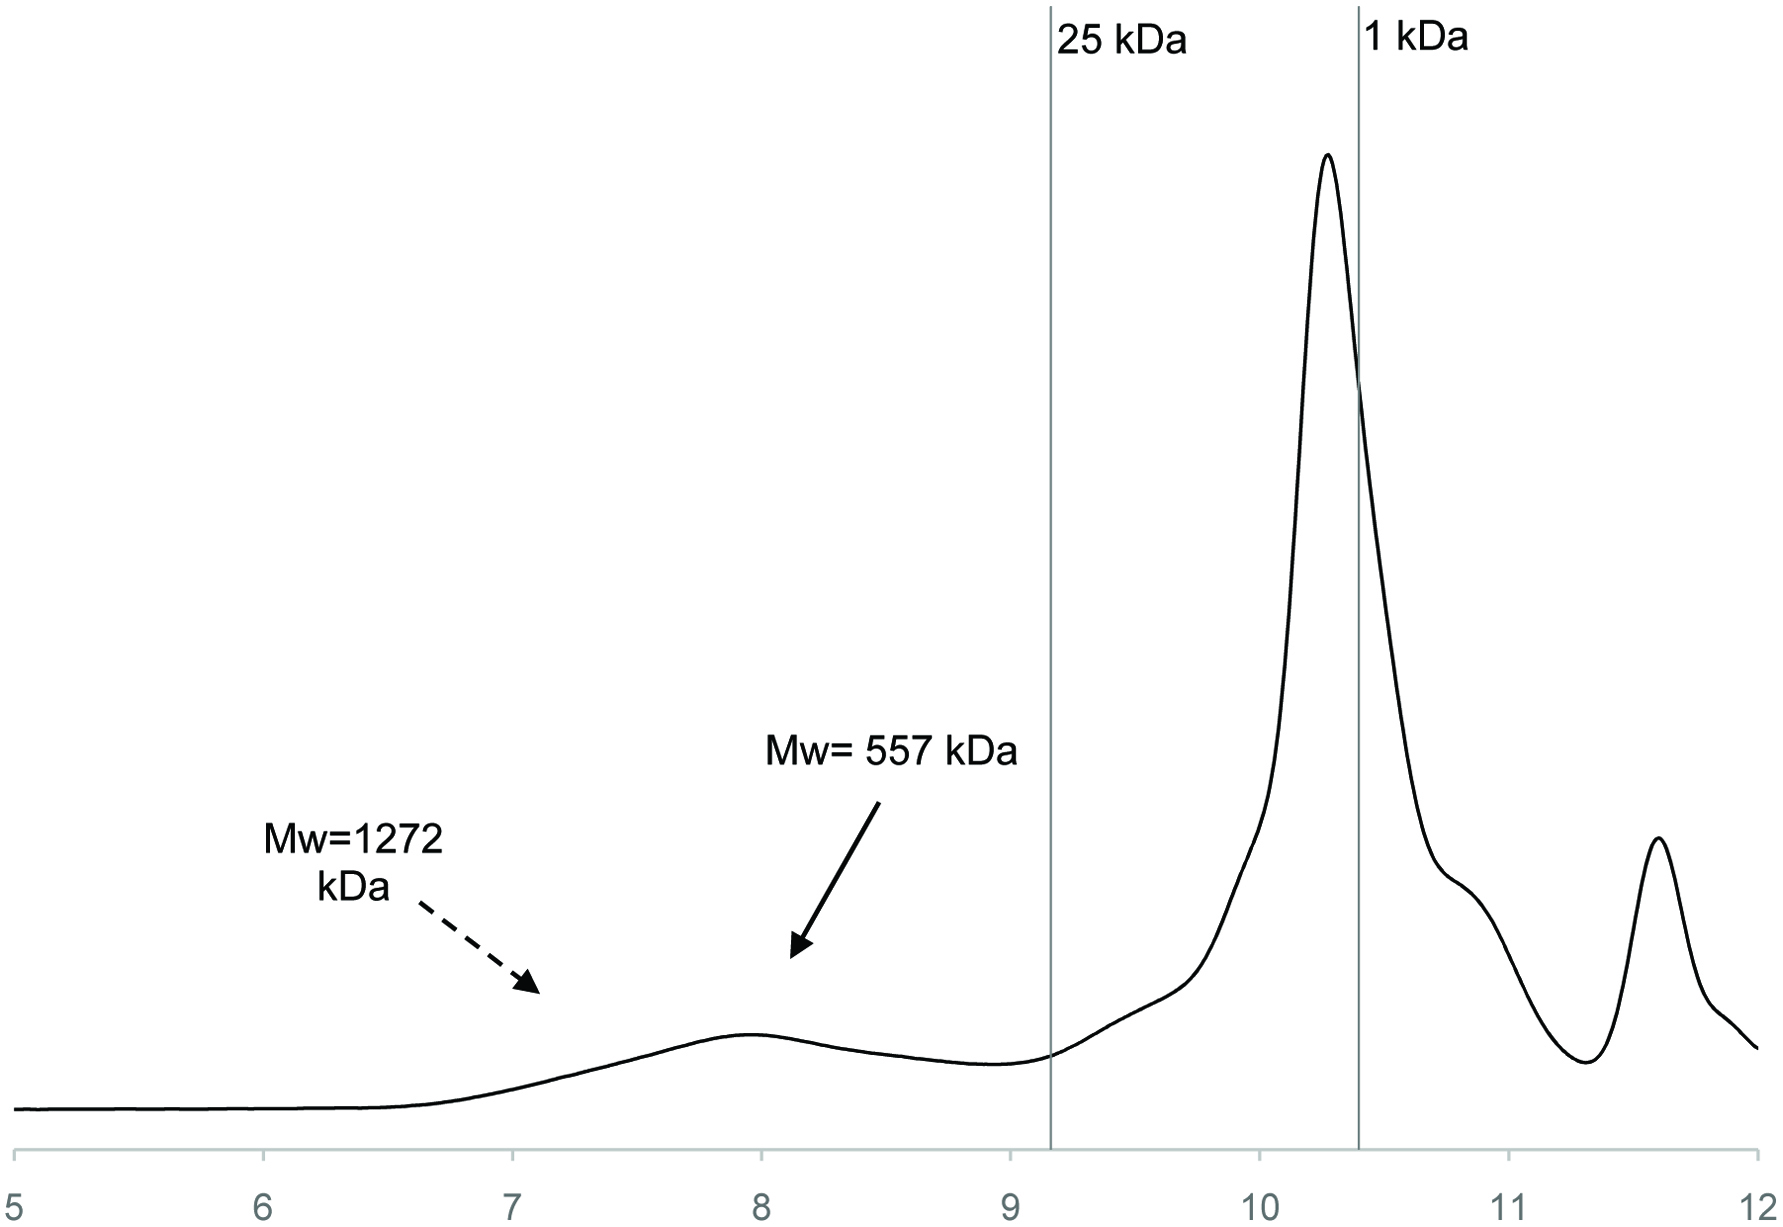 Click for large image | Figure 2. Molecular weight distribution of green tea polysaccharides. |
3.3. FT-IR analysis of GTPS
The FT-IR spectra of GTPS showed characteristic peaks for polysaccharides (Figure 3). Peaks at 1,000–1,200, 2,800–3,200, and 3,200–3,600 cm−1 are characteristic for polysaccharides, the broadly intense peak at 3,310 cm−1 represented the stretching vibrations of O–H, while the weak band at 2,920 cm−1 was attributed to the C–H stretching and bending vibrations. The relatively strong absorption peak at 1,627 cm−1 was in association with absorbed water. A combination of two intensive bands at 1,405 and 1,323 cm−1 were characteristic of C–O stretch and C–H or OH bending. The broad band at 1,107 and 1,020 cm−1 suggested the presence of C–O–H side groups and C–O–C glycosidic band vibration and should be the characteristic absorption bands of pyran glycosides. The peaks around 910 and 800 cm−1 corresponded to skeletal modes of pyranose rings, which was characteristic of α-type glycosidic linkages between the sugar units (Chen et al., 2009).
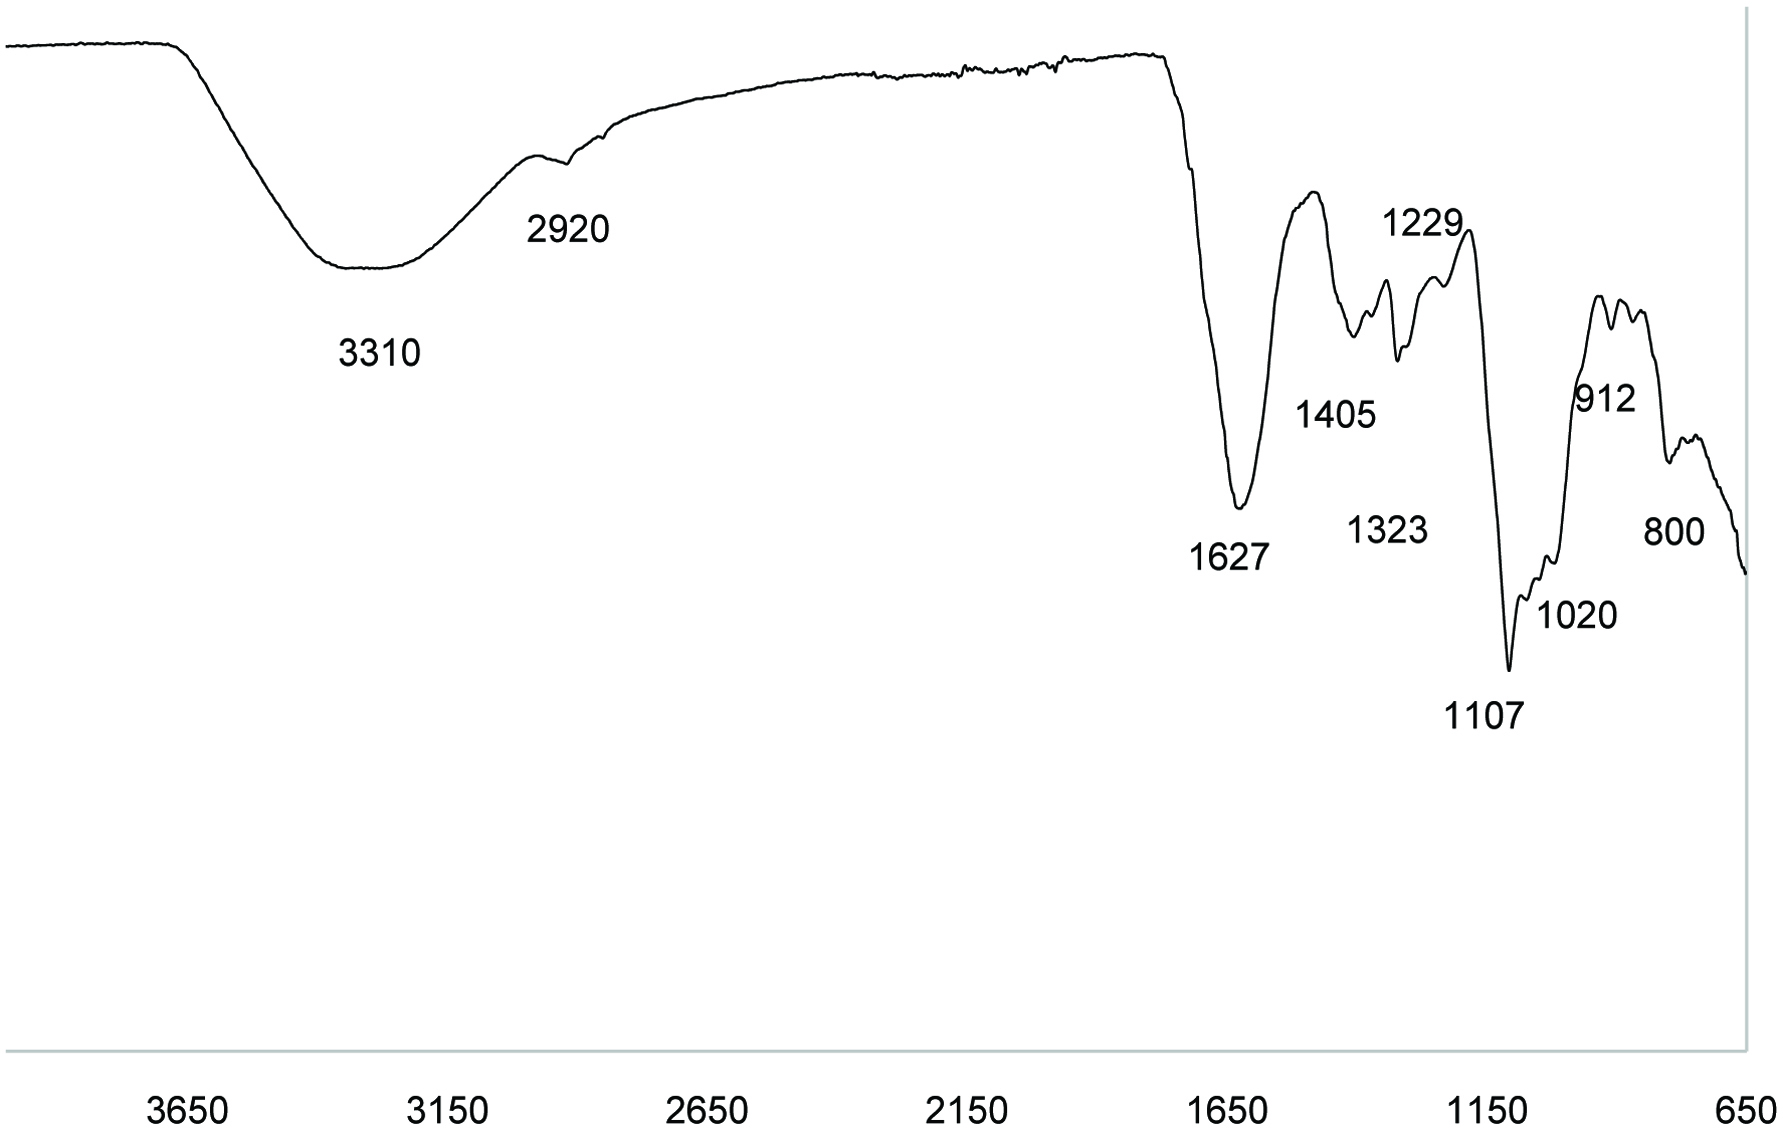 Click for large image | Figure 3. FT-IR spectra of green tea polysaccharides. |
3.4. Inhibitory effects on α-glucosidase activity
As shown in Table 3, GTPS had a dose-dependent effect on α-glucosidase inhibitory activity and the inhibition rose from 7.15 to 91.86% as the concentration increased from 0.025 to 0.5 mg/mL. Increasing the concentration further did not alter the inhibition ratio. As a positive control, at 1.25 mg/mL of acarbose concentration, 27.80% inhibition on α-glucosidase was observed whereas GTPS showed 93.41% inhibition.
Click to view | Table 3. Inhibitory effects of green tea polysaccharides on α-glycosidase activity |
The α-glucosidase inhibitors are of current interest owing to their promising therapeutic potential for diabetic treatment as oral hypoglycaemic agents. The α-glucosidase inhibitors act on the brush border of intestinal mucosa to inhibit the post-meal blood glucose level from rising and decrease fasting blood glucose, to some extent, by delaying the carbohydrates digestion and absorbance at intestine (Wei et al., 2010).
3.5. Toxicity tests of GTPS
GTPS were evaluated for their toxicity by performing cytotoxicity and genotoxicity tests. Additionally, the LD50 value of GTPS was determined to assess the safe use level as a dietary supplement.
According to the results of cytotoxicity test, IC50 value was determined as 0.98 mg/mL. This result shows that the GTPS was not cytotoxic at the active concentrations (Figure 4). Below 0.625 mg/mL concentrations, GTPS reached viability values similar to growth control which indicates the safety of it. In addition, AMES MPF assay was used to identify the genotoxicity of GTPS (Table 4). More than 25 positive wells were observed with positive and negative controls. The results showed less than 8 positive wells in the presence and absence of S9 with TA98 and TA100; which are the requirements of AMES MPF test validation. It was also observed that GTPS did not reach any of the indicated increases at baseline in the presence and absence of the S9 enzyme fraction in both strains (Figure 5). Furthermore, although GTPS has significant differences at some doses, no significant dose-response tendency was observed between the consecutive doses (P > 0.05). Therefore, GTPS had no mutagenic effect according to AMES test results.
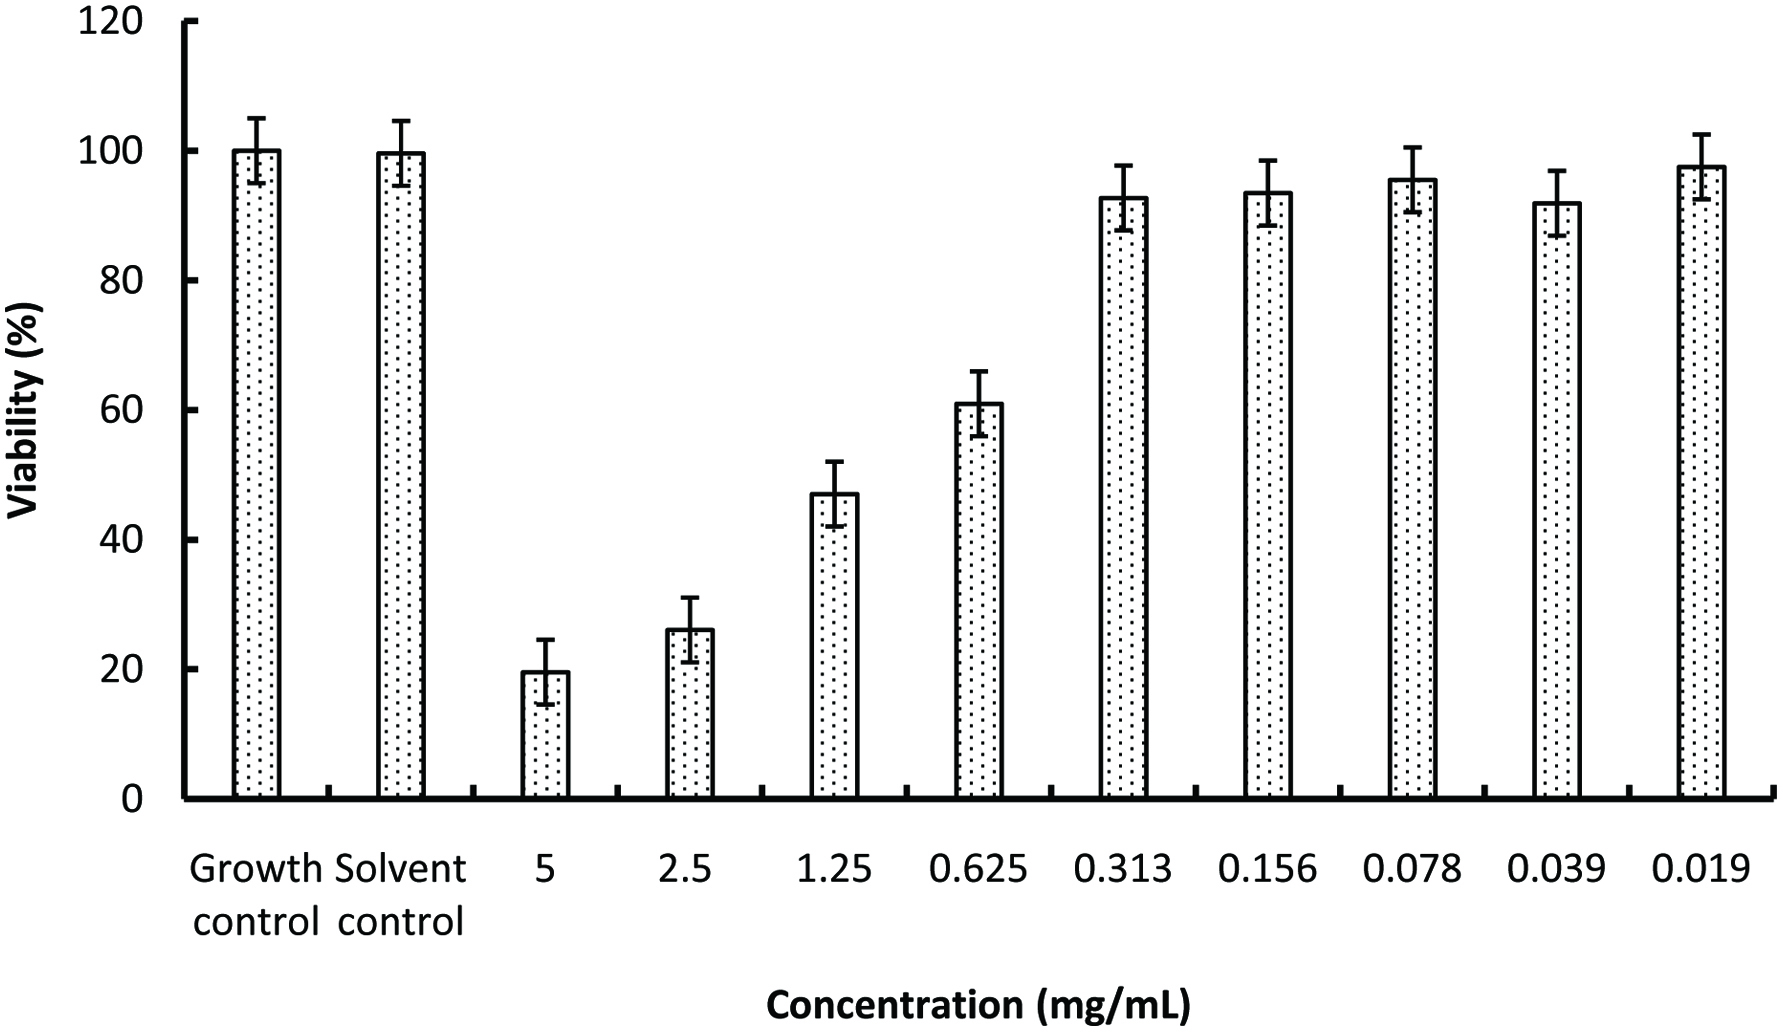 Click for large image | Figure 4. Percentage viability of green tea polysaccharides. Data are expressed as the mean ± SD (n = 3). |
Click to view | Table 4. The result of AMES microplate format genotoxicity test of green tea polysaccharides |
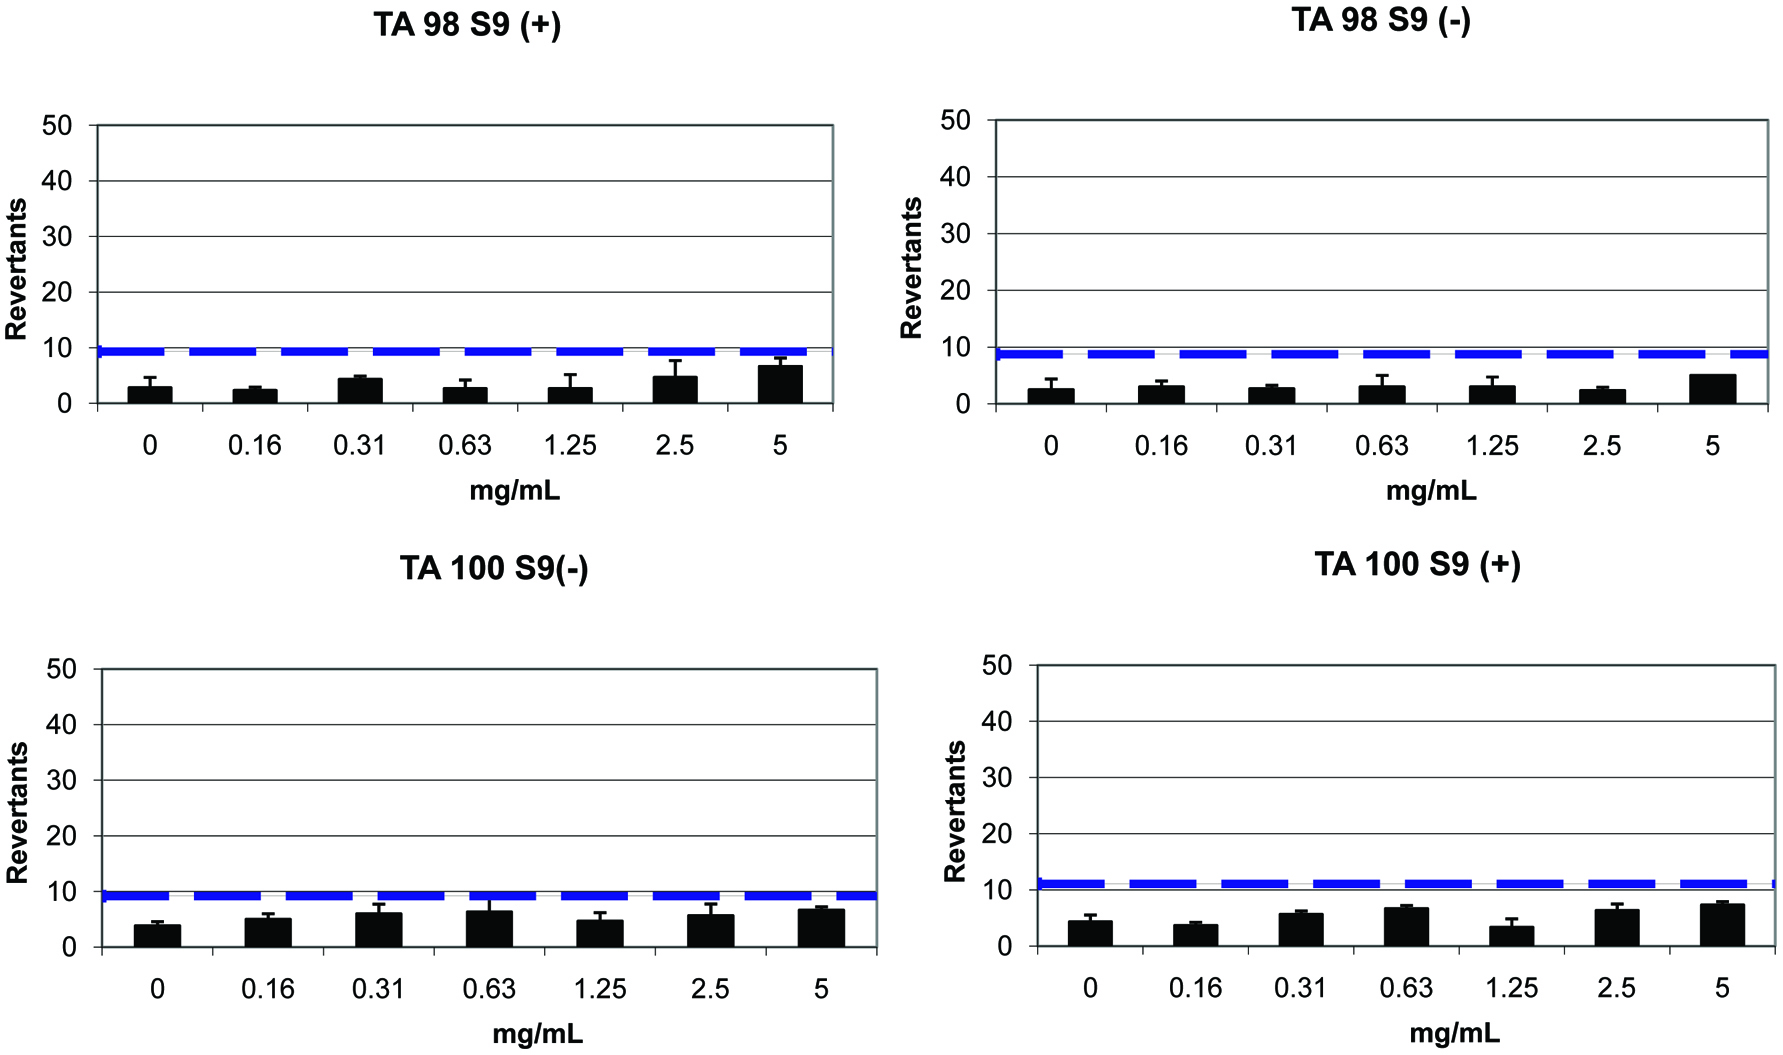 Click for large image | Figure 5. The results of AMES microplate format test of green tea polysaccharides in TA 98 and TA 100 strains (— 2-fold induction over the baseline). |
The limit test protocol was applied to identify the LD50 value of GTPS as specified in Annex 3 of the OECD 423 test protocol. GTPS was administrated to mice by gavage with 5,000 mg/kg dose level. Animals were monitored for mortality and after 5 days the experiment was terminated. None of the GTPS administrated mice died during the trial. Following single dose gavage application of the sample, the experimental animals were observed at short intervals for the first 4 hours. Abnormal clinical findings were also absent in animals during the entire experiment. Significant weight loss was not observed in the test mice (>10%) and normal liver weight index values were recorded. At the end of the observation period, all mice were subjected to gross pathology examination. As expected, no pathological findings were noticed in the examinations. According to these results and the survival of all three mice, GTPS was categorized as “GHS 5 or unclassified” according to the OECD 423-Acute Oral Toxicity (acute toxicity classification method) test method.
| 4. Conclusion | ▴Top |
GTPS was a protein bounded acidic polysaccharide and had arabinogalactan structure. α-Glucosidase inhibitory activity of GTPS was dose dependent and it was 93.41% at a concentration of 1.25 mg/mL, whereas acarbose, as synthetic anti-diabetic drug, only showed 27.80% inhibition at the same concentration. Due to its potential to be considered as an antidiabetic dietary supplement in food and medicinal fields, GTPS were further evaluated for toxicity which demonstrated no cytotoxic and no mutagenic effects. The acute toxicity study also showed that the LD50 of GTPS was greater than 5,000 mg/kg and it was categorized as “HHS 5 or unclassified”. All these findings suggest that GTPS can be employed as an antidiabetic dietary supplement without posing any potential health risk.
Acknowledgments
This study is a part of project funded by TÜBİTAK (under 1003 programme-project no 105O037). We are grateful to ÇAYKUR Tea Enterprise for providing tea samples.
| References | ▴Top |