| Journal of Food Bioactives, ISSN 2637-8752 print, 2637-8779 online |
| Journal website www.isnff-jfb.com |
Original Research
Volume 21, March 2023, pages 28-34
LC-MS analysis of urolithin-related metabolites in human plasma reveals glucuronide conjugates as the primary species after 4-weeks of pecan consumption
Min Jeong Kanga, #, Joon Hyuk Suha, #, Liana L. Guarneirib, Jamie A. Cooperb, Chad M. Patona, b, *
aDepartment of Food Science and Technology, University of Georgia, 100 Cedar Street, Athens, GA 30602, USA
bDepartment of Nutritional Sciences, University of Georgia, 305 Sanford Dr., Athens, GA 30602, USA
*Corresponding author: Chad M. Paton, Department of Food Science and Technology, University of Georgia, 100 Cedar Street, Athens, GA 30602, USA. E-mail: cpaton@uga.edu
DOI: 10.31665/JFB.2023.18336
Received: February 7, 2023
Revised received & accepted: March 10, 2023
| Abstract | ▴Top |
The purpose was to determine whether chronic pecan consumption leads to increases in Urolithin (Uro) levels in humans. Second, was to determine the pattern of Uro changes from 0- to 4-weeks among the Uro isoforms (Uro-A, -B, and -C) and their glucuronide conjugates. Forty-five Subjects were divided into control (no nut) and pecan (68 grams/day (g/day)) groups. Samples were collected at baseline (0-weeks) and 4-weeks after consuming either no nuts in the diet (control) or 68g/day of pecans in the pecan group. Using liquid chromatography-mass spectrometry (LC-MS), plasma Uro-A, -B, and -C levels and their phase II glucuronide metabolites were measured against known standards at 0- and 4-weeks. Uro-A (0.0–0.1 ng/mL) and -C (0.01–0.5) both increased significantly at 4-weeks while Uro-B was undetectable in plasma. The glucuronide conjugates were significantly higher than their free-forms, and all three conjugates increased from 0- to 4-weeks with Uro-A-glucuronide the highest at 2.6–106 ng/mL.
Keywords: Pecan bioactives; Phase II metabolism; Ellagic acid; Glucuronide conjugation; Urolithin metabolites
| 1. Introduction | ▴Top |
In recent years, our understanding of the bioactive properties of food has gained in popularity with particular attention to polyphenols, especially ellagitannins (ET) and ellagic acid (EA). Tree nuts, including pecans (Carya illinoinensis), contain relatively high amounts of polyphenols in the form ET and EA, both of which possess strong antioxidant properties (Domínguez-Avila et al., 2015; Kureck et al., 2018), but neither of which are absorbed well through the gut wall. However, when ET and EA are consumed, bacterial metabolism in the gastrointestinal tract modifies them into the bioactive and bioavailable Urolithins (Uro’s) (Espín et al., 2013; Kujawska and Jodynis-Liebert, 2020).
Uro’s were identified over 20 years ago and in that time, they have gained a large amount of attention for their purported bioactive properties including antioxidant capacity, anti-inflammatory actions, aging, amyloidogenesis, and most recently, regulation of mitophagy (Andreux et al., 2019; Lee et al., 2021; Ryu et al., 2016; Tao et al., 2021). For a more comprehensive review, please see (D’Amico et al., 2021). Several major isoforms of Uro’s have been identified, including Uro A-D, along with other minor isoforms (i.e. Uro-M and Isourolithins). They have shown differential functional effects depending on route of delivery, model system, or functional outcome leading to inconsistency in the purported role of Uro’s in general, as well as isoform-specific functions. However, despite these inconsistencies, there is a general understanding that Uro’s can induce biofunctional activities in vivo as a property of their unique chemistry.
Uro-A (3,8-Dihydroxy-6H-dibenzo[b,d]pyran-6-one) contains two potentially reactive hydroxyl groups, while Uro-B, Uro-C, and Uro-D contain one, three, and four, respectively (Noshadi et al., 2020). In addition to (or as a result of) the variance in chemistry of the Uro’s, their tissue distribution in animal models suggests differences in secondary metabolism once in the circulation. In fact, most studies indicate that tissue-specific phase II metabolism of Uro’s results in the generation of Uro-glucuronide conjugates. This is not surprising given the presence of at least one free hydroxyl group on Uro’s. Thus, it is reasonable to assume they would be preferentially conjugated in order to minimize their bioactivity to maintain homeostasis (Bobowska et al., 2021).
There have been relatively few studies that looked at the plasma appearance of Uro’s and their glucuronide conjugates in humans, and even fewer that examined these changes over long-term consumption of ET- and EA-rich foods. Most studies to-date have looked at acute changes following ingestions of a single food source or purified Uro species. Those studies reported increases in free and conjugated Uro’s after approximately 24-hours (Bobowska et al., 2021; García-Villalba et al., 2013), but when only looking at acute ingestion, the adaptive response, if any is not known. One study compared the effect of 4 weeks of red raspberry ingestion on Uro-A in plasma and reported a modest, albeit significant, change with relatively high variance among subjects (Zhang et al., 2020). Direct supplementation with Uro-A provides more conclusive evidence that unconjugated Uro-A levels will increase if given sufficient quantities of purified precursor, but whether or not Uro-A (conjugated or unconjugated) is the dominant form cannot be determined from single-source supplementation (Singh et al., 2022).
In light of these discrepancies and unanswered questions, we sought to examine the impact of 4 weeks of daily pecan consumption on changes in plasma Uro-A, -B, and -C, as well as their glucuronide conjugate forms. Healthy men and women were randomly assigned to either a no nut (control) group or a pecan consumption group (Pecan) that consumed 68g pecans/day. We hypothesized that plasma Urolithins and their glucuronide conjugates would increase in the Pecan group after 4-weeks of pecan consumption and that the control group would have non-significant changes in Uro’s or their conjugates. To test this hypothesis, we performed liquid chromatography-mass spectrometry (LC-MS) analysis of plasma samples collected from control and Pecan groups at 0- and 4-weeks.
| 2. Materials and methods | ▴Top |
2.1. Study design and participants
The study design was a randomized, parallel control trial (clinicaltrials.gov: NCT04376632) with an 8-week intervention (Guarneiri et al., 2021). Forty-five subjects completed the study, with 25 in the control and 20 in the pecan groups. Fasting blood samples were collected at baseline (Visit 1: V1), 4-weeks (Visit 2: V2), and again at 8-weeks (Visit 3: V3) post intervention. For the current analysis, only baseline (V1) and 4-week (V2) samples were assessed. Subjects were randomly assigned to either a no-nut (control) group where they were instructed to abstain from consuming any nuts during the study period, a pecan add group, where subjects were instructed to add 68 grams/day (g/d) of pecans to their normal daily diet, and a pecan sub group where subjects were instructed to consume 68 g/d of pecans and to remove the caloric equivalent from their diet from other foods. For the present study, only the no-nut control and pecan sub (Pecan) groups were studied. All procedures were in accordance with the Declaration of Helsinki and were approved by the Institutional Review Board at the University of Georgia. Written consent was obtained from all subjects.
2.1. Chemicals and reagents
Urolithin A (Uro-A), urolithin B (Uro-B), urolithin C (Uro-C), and ellagic acid (EA) were purchased from Sigma-Aldrich (St. Louis, MO, USA). Urolithin A glucuronide (Uro-A-G) and urolithin B glucuronide (Uro-B-G) were purchased from Toronto Research Chemicals Inc. (North York, ON, Canada). Acetonitrile (ACN), methanol, water, and formic acid were LC-MS grade. Water and formic acid were purchased from Fisher Scientific (Fair Lawn, NJ, USA) and methanol and acetonitrile were obtained from Sigma-Aldrich.
2.2. Preparation of standard solutions
Stock solutions of individual compounds were prepared at a concentration of 1,000 μg/mL. Uro-B and Uro-B-G were dissolved in ACN. Uro-A and Uro-A-G were prepared in dimethyl sulfoxide (DMSO)-ACN (1:4) and Uro-C was in DMSO-ACN (1:1). EA was dissolved in DMSO. All stock solutions were stored at −80 °C until use. Standard mixture solution was prepared by diluting stock solutions with ACN.
2.3. Sample preparation
Plasma samples (200 μL) were placed in a 1.5 mL tube, and were extracted with 600 μL ACN:formic acid (98:2, v/v). The samples were vortexed for 10 min followed by sonication for 10 min. After centrifugation (17,000 g, 10 min), the supernatant was dried under a nitrogen stream. The dried residue was reconstituted with 100 μL of methanol and was filtered through a 0.22 µm PVDF membrane filter before LC-MS analysis.
Calibration standards of urolithins (Uro-A, Uro-B, Uro-A-G, Uro-B-G, and Uro-C) and EA were prepared by adding the mixture of standards in blank plasma. The calibration samples were extracted as described above. The ranges of calibration levels for each compound were determined based on the observed concentrations from the plasma samples.
2.4. LC-MS analysis
LC-MS analyses were carried out using an Agilent 1260 Infinity II UHPLC system coupled to a 6470 Triple quadrupole (QqQ) mass spectrometer (Agilent Technologies, Santa Clara, CA, USA). Analytes were separated using a Zorbax Eclipse Plus C18 column (2.1 × 50 mm, particle size 1.8 μm) at a column temperature of 30 °C using a gradient elution. Water:formic acid (99.9:0.1, v/v) and ACN:formic acid (99.9:0.1, v/v) were used as mobile phase A and B, respectively, with a flow rate of 0.4 mL/min. The linear gradient started with 5% of solvent B, reaching 95% solvent B at 4 min. The column was re-equilibrated in 3 min using the initial composition of the mobile phase (5% solvent B). The injection volume was 2 μL. The mass spectrometer was equipped with electrospray ionization (ESI) interface, operating in the negative ionization mode. The following ESI parameters were employed: gas temperature 325 °C, gas flow 10 L/min, nebulizer pressure 20 psi, sheath gas temperature 400 °C, and sheath gas flow 11 L/min. All compounds were monitored in the multiple reaction monitoring mode (MRM) with dwell time 50 msec. The optimization of MRM conditions was conducted via flow injection analysis of individual standards. The optimum MRM transitions, collision energies, fragmentor voltages, and cell accelerator voltages are shown in Table 1. Urolithin C glucuronide (Uro-C-G; commercially not available) was tentatively identified based on its predicted fragmentation patterns similar to those of Uro-A-G and Uro-B-G. The product ion of Uro-C-G, with loss of glucuronide moiety (m/z 176), was identical to the precursor ion of Uro-C. MassHunter software (Agilent Technologies, Waldbronn, Germany) was used for data acquisition and data processing.
 Click to view | Table 1. Optimal MS/MS parameters for EA, Uro-A, Uro-B, Uro-C, Uro-A-G, Uro-B-G and Uro-C-G |
2.5. Method validation
The developed method was validated in terms of selectivity, linearity, and limit of quantification (LOQ) for the analytes (EA, Uro-A, Uro-B, Uro-C, Uro-A-G, and Uro-B-G). The selectivity was determined by analyzing blank plasma to see if there is any interference effect at the retention time of each analyte. For linearity, six concentration levels of standard mixtures in blank plasma were prepared (EA: 1–200 ng/mL, Uro-A: 0.1–20 ng/mL, Uro-B: 3–600 ng/mL, Uro-C: 0.2–40 ng/mL, Uro-A-G: 0.5–200 ng/mL, and Uro-B-G: 0.5–100 ng/mL). Calibration curves were created by plotting peak area of each analyte. The LOQ was calculated based on a signal-to-noise ratio (S/N) of 10 in blank plasma. The pooled quality control (QC) samples were prepared by using samples of 4 weeks of daily pecan consumption. QCs were injected every 10 samples in each batch. The batch reliability was evaluated by comparing each analyte’s signals in QC samples (criterion: relative standard deviation, RSD <15%).
2.6. Statistical analysis
Statistical analysis was carried out using RStudio (Boston, MA, USA). The analysis of variance (ANOVA) was performed to investigate the significance of results within each compound among different samples. When significant differences were detected, the Tukey pairwise comparison test was performed to separate the means at p < 0.05. For statistical analysis, non-detected groups were applied as 0.00 concentration.
| 3. Results | ▴Top |
3.1. Method evaluation results for urolithin-related metabolites
The chromatograms of analytes (EA, Uro-A, Uro-B, Uro-C, Uro-A-G, Uro-B-G, and Uro-C-G) in plasma are shown in Figure 1. No interference was observed at the retention time of analytes when blank plasma and real samples were analyzed. A trace level of Uro-A-G was detected in blank plasma samples (data not shown), while it could be neglectable. This might be derived from dietary sources other than the pecans. Sufficient linearity was obtained for all analytes, with high correlation coefficient (r2) values above 0.999 (Figure 2). The LOQs were shown in Table 2. The analytes were measurable at the pg/mL (ppt) level (except Uro-B), and the analytical sensitivities were proven to be better than those of a previous study for urolithin analysis (Table 2) (García-Villalba et al., 2016).
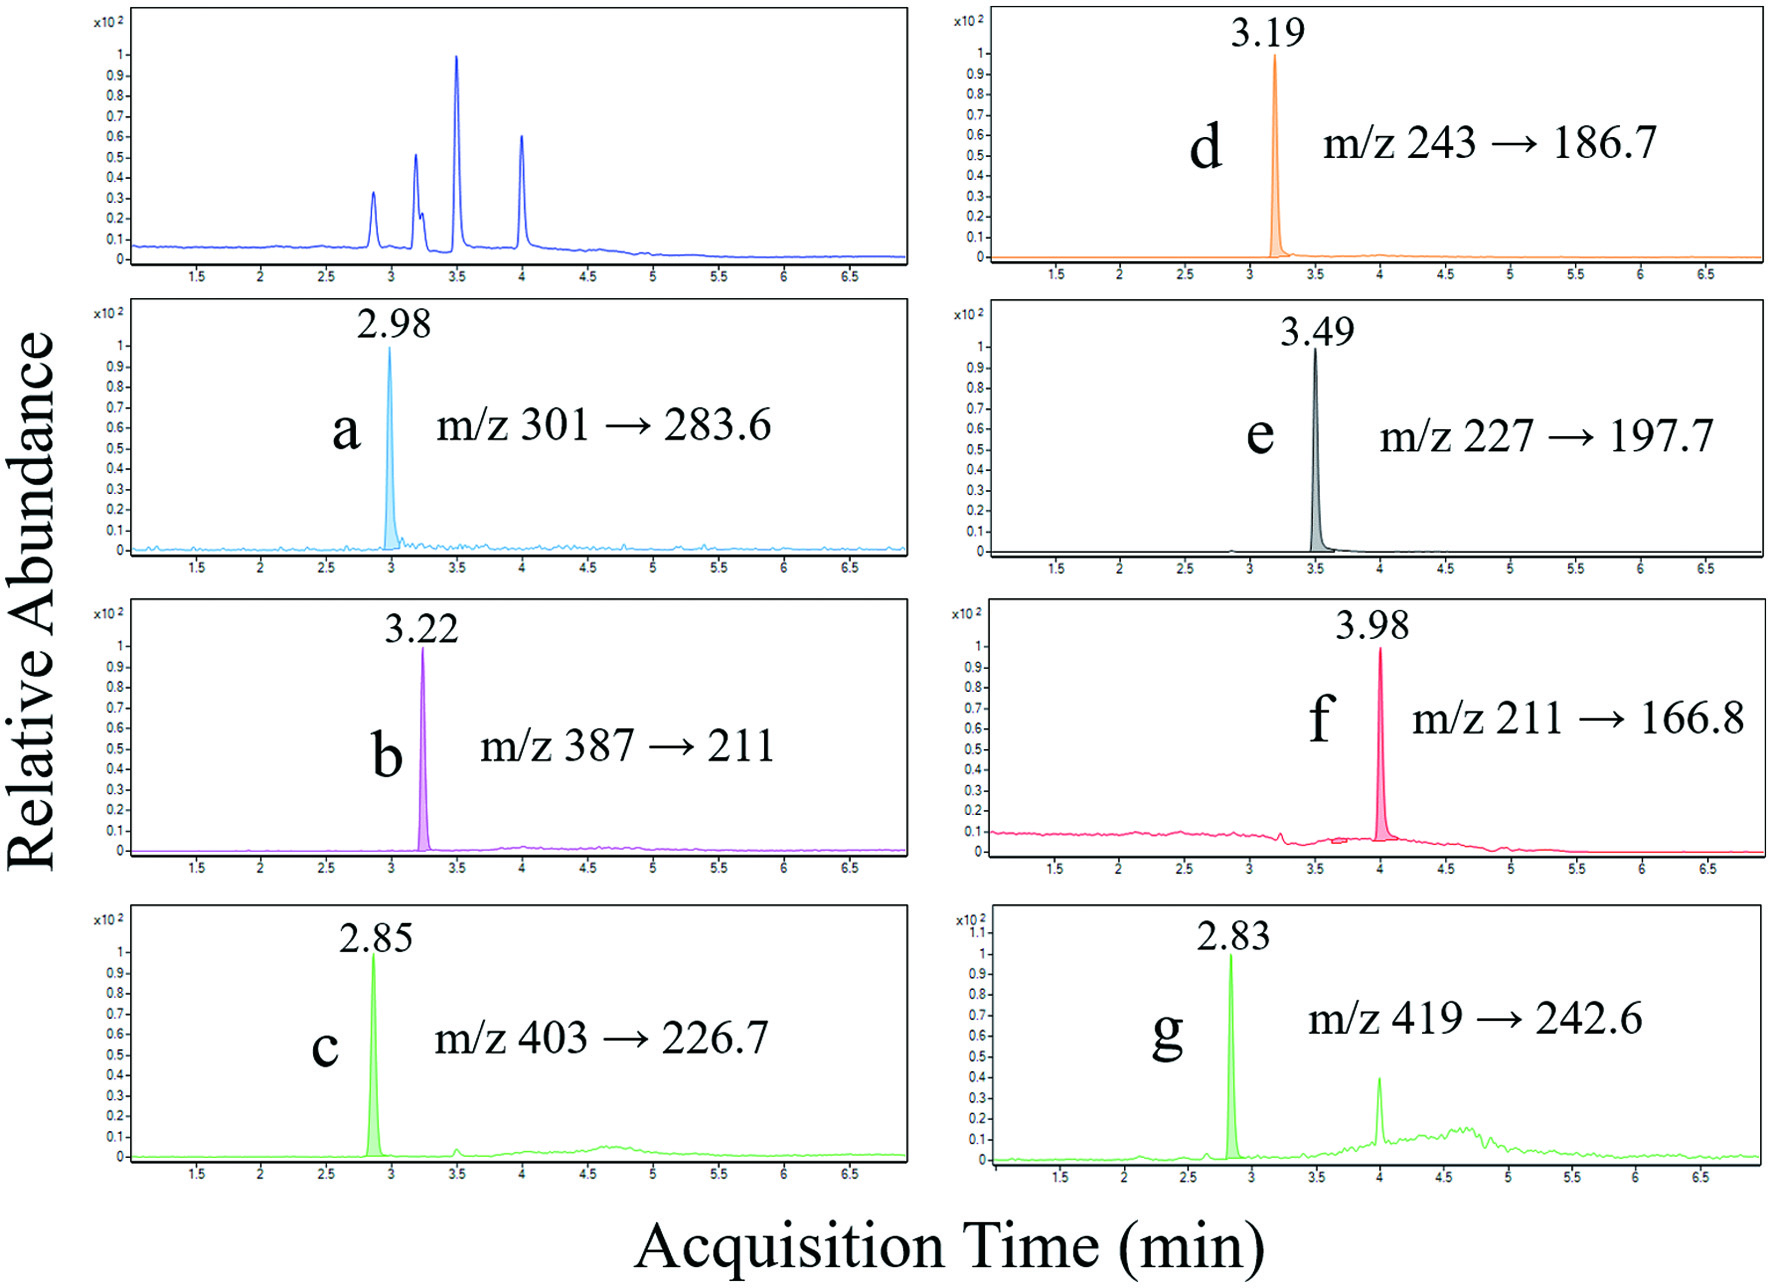 Click for large image | Figure 1. LC-MS MRM chromatograms of (a) EA, (b) Uro-B-G, (c) Uro-A-G, (d) Uro-C, (e) Uro-A, (f) Uro-B, and (g) Uro-C-G (tentatively identified) in plasma. |
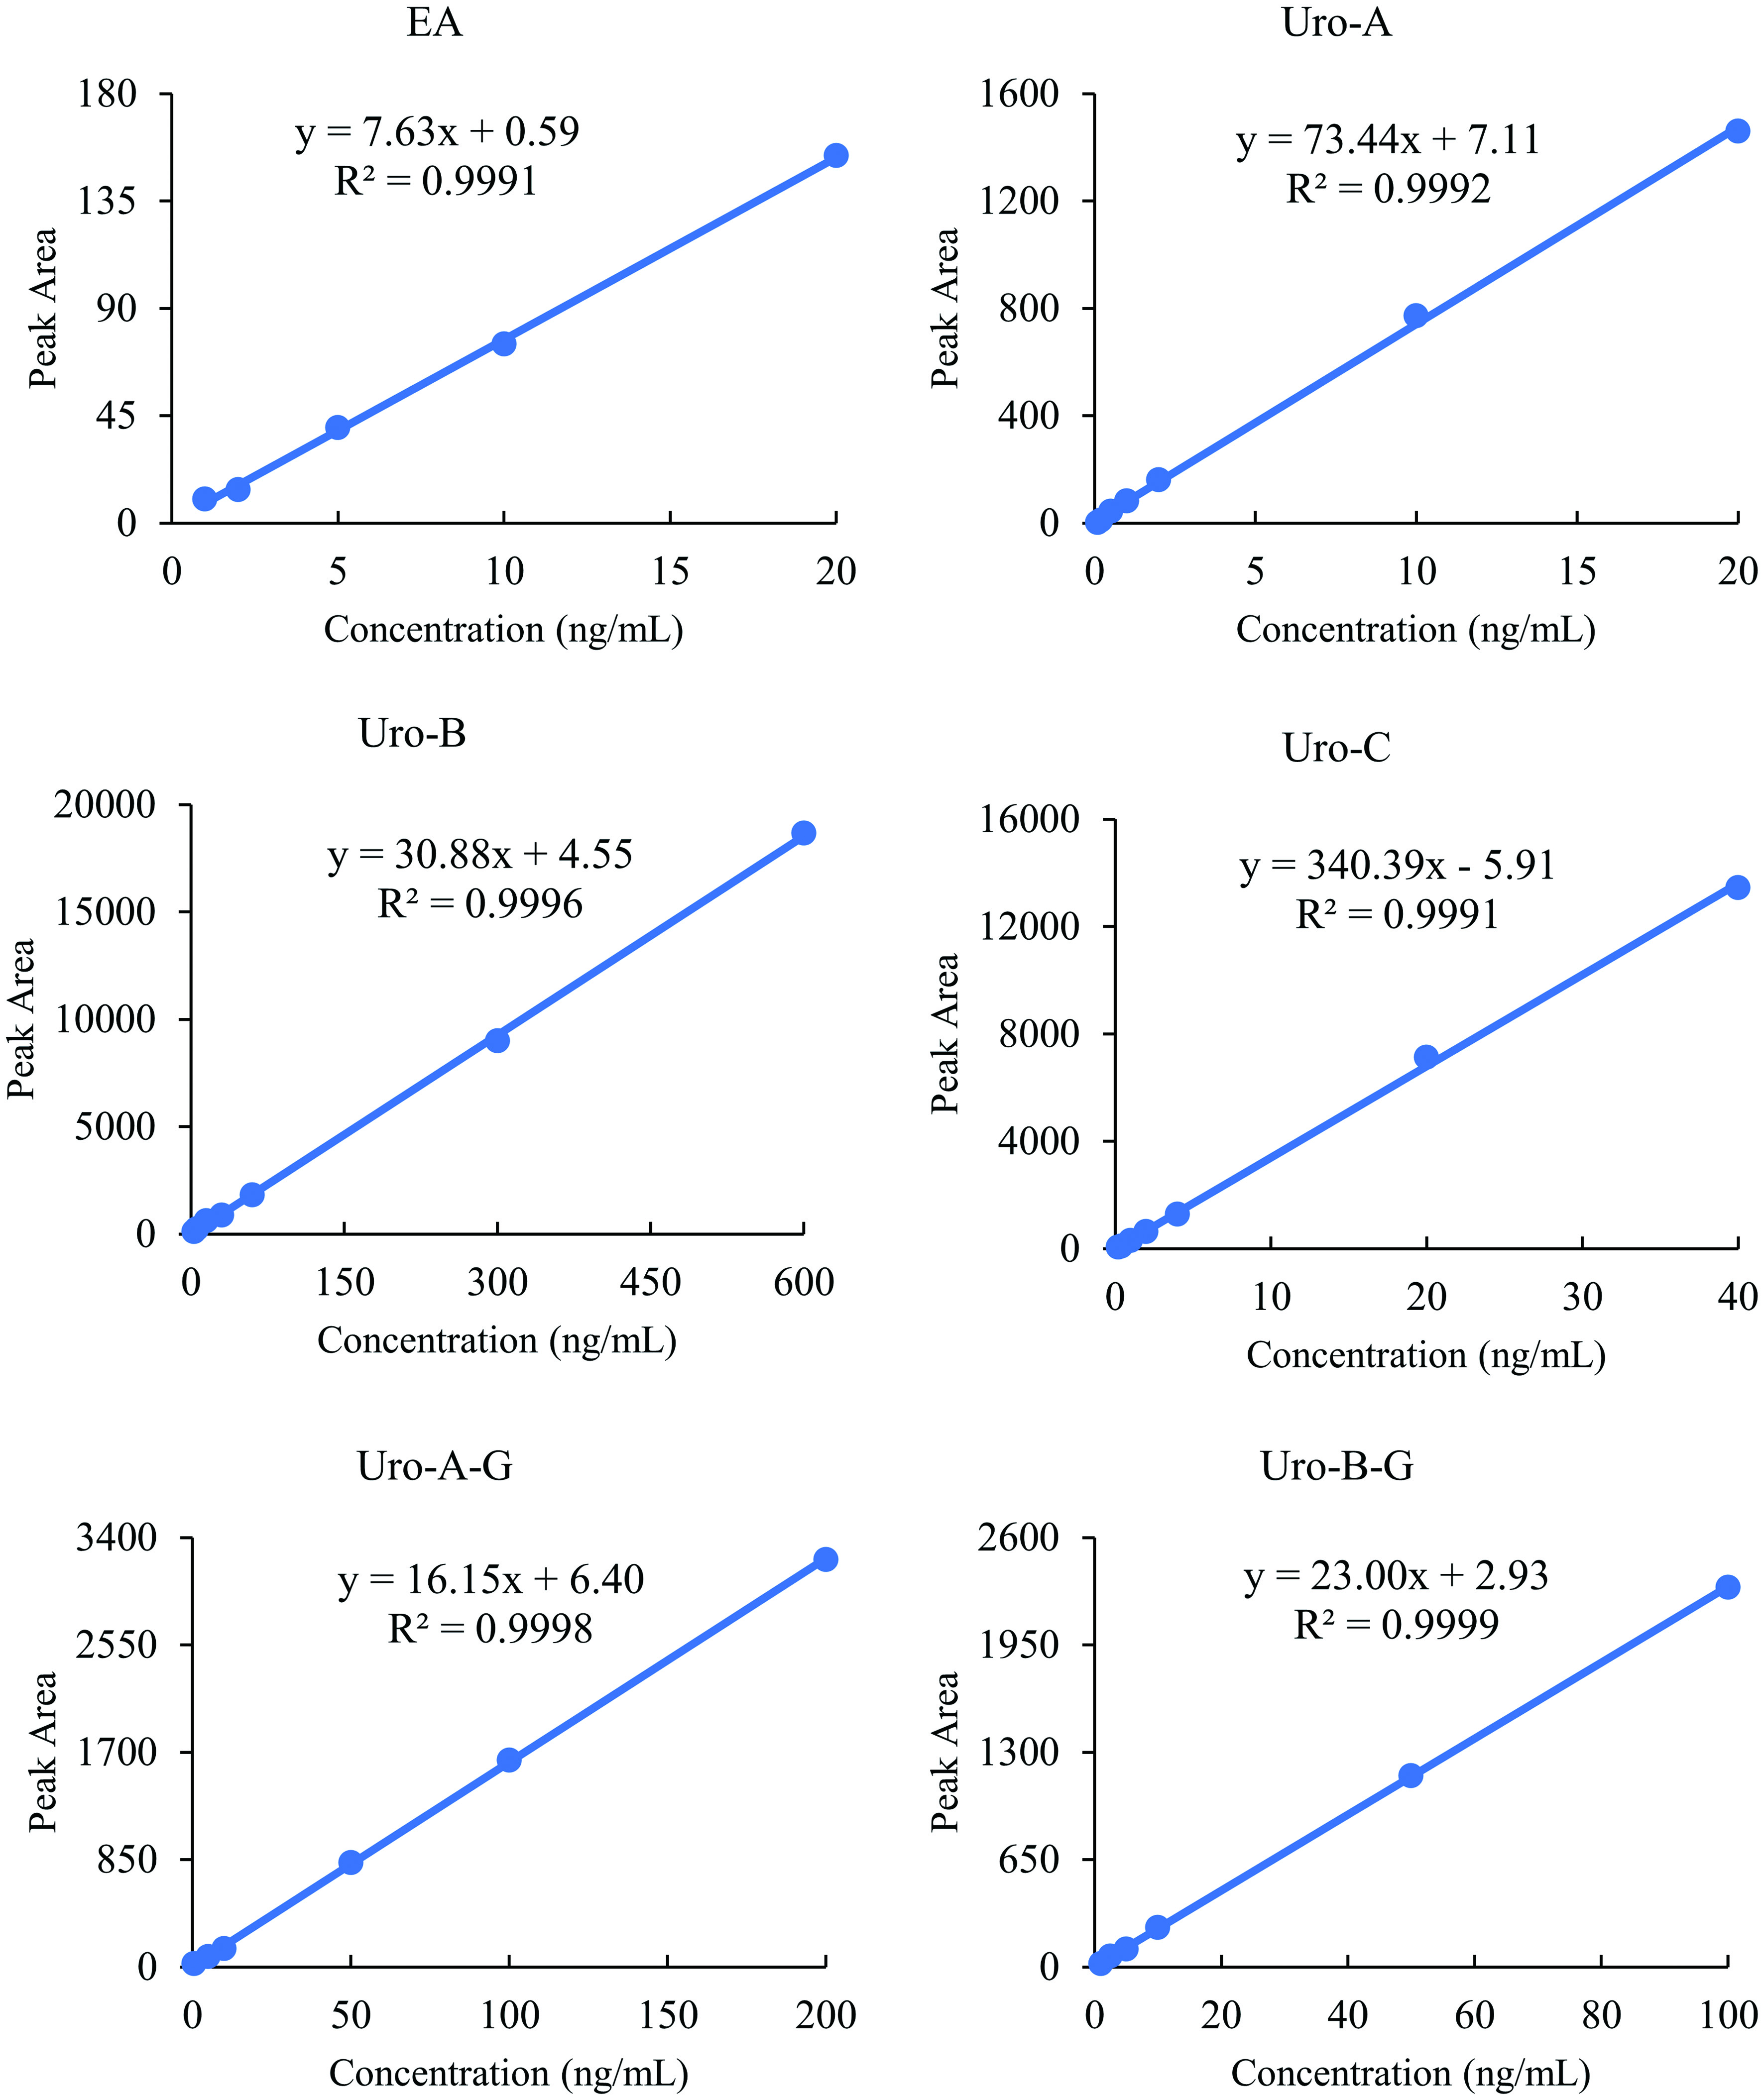 Click for large image | Figure 2. Linearity for EA, Uro-A, Uro-B, Uro-C, Uro-A-G, and Uro-B-G. |
Click to view | Table 2. Comparison of limit of quantification (LOQ) for EA, Uro-A, Uro-B, Uro-C, Uro-A-G, and Uro-B-G in plasma |
The batch reliability (analytical precision) was confirmed by comparing the results of pooled QCs in the batch as represented in Table 3. The RSD of detected metabolites (Uro-C, Uro-A-G, Uro-B-G, and Uro-C-G) in the QC samples was within 12.9%. Due to their low incidence and sensitivity, EA, Uro-A and Uro-B were not observed in the QC samples.
Click to view | Table 3. Evaluation of batch reliability using pooled QC samples (n = 7) |
3.2. Quantification results of urolithin-related metabolites
The quantification results of EA and Uro in plasma are shown in Table 4 and Table S1. Among the seven analytes, six metabolites (EA, Uro-A, Uro-C, Uro-A-G, Uro-B-G, and Uro-C-G) were detected in plasma samples (Table 4). EA was found in a few samples, because it may be actively metabolized into urolithins in human body. It was reported that EA was only detectable after 1 h post-ingestion of pomegranate juice in human plasma, and rapidly eliminated within 4 hours(Seeram et al., 2004). Uro-A, Uro-C, Uro-A-G and Uro-C-G (especially, Uro-A-G) were only observed in the pecan consumption group at 4 weeks.
Click to view | Table 4. Concentrations of EA, Uro-A, Uro-B, Uro-C, Uro-A-G, Uro-B-G, and Uro-C-G in plasma samples of human study after 0 week and 4 weeks of 68g/day intake of pecans |
| 4. Discussion | ▴Top |
Uro glucuronide conjugates are known as the dominant metabolite form of Uro’s in plasma(Gonzalez-Barrio et al., 2011; Tomás-Barberán et al., 2014). A previous study of pomegranate capsule intake (4 capsules; a single intake; 450 mg/g capsule) also showed Uro-A-G as a major metabolite indicator in plasma(García-Villalba et al., 2016). Based on these results, Uro-A-G might be a potential marker (possibly, together with Uro-A, Uro-C and Uro-C-G) in plasma for pecan consumption and related health effects. Using LC-MS, we were able to identify all three isoforms and their glucuronide conjugates in reference samples. We were able to detect a small increase in plasma Uro-A and interestingly Uro-C was 4-times higher than Uro-A. Most importantly, Uro-A glucuronide was 1,000-fold higher than free Uro-A whereas Uro-C glucuronide was not different than free Uro-C. The results of the present study suggest that differential phase-II metabolism of Uro’s leads to varying levels of Uro’s across species and that in vitro studies focusing on free Uro’s may need to consider glucuronide conjugates rather than free Uro’s in their design.
It was interesting to see that Uro-A and -B were the lowest of the three unconjugated Uro’s and that EA was higher in plasma than both. Additionally, the relatively high amount of Uro-C suggests that the latter is the predominant isoform in plasma, at least with pecan consumption. We expected Uro-A to be the highest, but if we consider that Uro-A-G was the most abundant of all forms assessed, it agrees with our hypothesis. However, this assumes that Uro-A is the predominant isoform and that it undergoes phase II metabolism to form the glucuronide conjugate. It would be important to determine if purified supplemental Uro-A is preferentially conjugated or whether it can increase in plasma in the unconjugated form.
Similar to our hypothesis that Uro’s and their glucuronide conjugated isoforms would increase following pecan consumption, we assumed that the changes in conjugates were from hepatic phase II metabolism (Bobowska et al., 2021; González-Sarrías et al., 2014; Piwowarski et al., 2017). While it does not limit the interpretation of the present results, we cannot exclude the possibility that intestinal phase II metabolism is not a contributing factor. Additional studies should be conducted in animal models to determine the relative contribution of tissue-specific metabolism of each isoform. Tissue-specific distribution, secondary metabolism, utilization, and elimination are likely to vary within Uro isoforms and further studies should examine these factors to better understand the in vivo physiological function in humans.
The majority of in vitro studies have focused on unconjugated Uro’s to determine its biological function. However, if there is a higher propensity toward conjugation, then studies should focus on the determination of biological effects of free versus conjugated Uro’s. A recent study compared the effects of free and glucuronide conjugated Uro’s on inflammatory gene expression in vitro and found isoform-specific variation, but also differences in TNFα and TGF-β1 expression Uro-A and Uro-A-G (Bobowska et al., 2021). Conversely, González-Sarrías et. al reported that cell proliferation was reduced to a greater extent with glucuronide conjugates of Uro’s A-C, suggesting that 1) glucuronide conjugated Uro’s are biologically active, and 2) their effects may vary by cell type and physiological function (González-Sarrías et al., 2014). In order to fully understand the role of Uro’s in mediating biological outcomes, a better description of the major metabolites and isoforms should be developed.
| 5. Conclusion | ▴Top |
The present study examined the response to consuming 68g/d of pecans for 4 weeks and determined the changes in Uro’s in plasma. It is expected that responses to other whole food sources would vary according to EA availability, digestibility, microbiome variation, and individual (genetic) differences. However, it should be noted that pecan consumption significantly increased all Uro isoforms as well as EA. Furthermore, while not an aim of the present study, it would be interesting to determine if Uro’s could serve as effective markers of compliance in feeding studies as opposed to more transient markers such as tocotrienols/tocopherols. Additionally, the health-related effects of Uro’s and pecan consumption may depend at least in part, on their phase II metabolism and future studies are needed to elucidate any potential link.
| Supplementary material | ▴Top |
Table S1. Concentrations of EA, Uro-A, Uro-B, Uro-C, Uro-A-G, Uro-B-G, and Uro-C-G in plasma samples (measured in duplicate).
Acknowledgments
This research was funded by the Georgia Pecan Commission. The sponsor had no role in study design; in the collection, analysis or interpretation of data; in the writing of the report; or in the decision to submit the article for publication.
These authors contributed equally.
Conflict of interest
None.
| References | ▴Top |