| Journal of Food Bioactives, ISSN 2637-8752 print, 2637-8779 online |
| Journal website www.isnff-jfb.com |
Original Research
Volume 20, December 2022, pages 29-39
Identification, quantitation and sensory elucidation of off-taste compounds in wheat bran
Tara Duggan, Julia Gilch, Timo D. Stark, Corinna Dawid, Thomas Hofmann*
Food Chemistry and Molecular Sensory Science, Technische Universität München, Lise-Meitner-Straße 34, 85354 Freising, Germany
*Corresponding author: Thomas Hofmann, Food Chemistry and Molecular Sensory Science, Technische Universität München, Lise-Meitner-Straße 34, 85354 Freising, Germany. Tel: +49-8161/71-2902; Fax: +49-8161/71-2949; E-mail: thomas.hofmann@tum.de
DOI: 10.31665/JFB.2022.18326
Received: October 14, 2022
Revised received & accepted: December 16, 2022
| Abstract | ▴Top |
Through sensory guided isolation and targeted as well as untargeted analytical techniques such as LC-MS/MS, LC-TOF-MS and 1D/2D-NMR experiments, as part of the SENSOMICS approach key off-taste compounds could be identified, quantified as well as sensorically characterized in wheat bran isolates. Alkenyl resorcinols, namely (Z)-5-nonadec-12/14-enylresorcinol as well as (Z)-5-heneicos-12/14/16-enylresorcinol could be identified as major bitter compounds in wheat bran for the first time. Furthermore, saturated analogues, alkyl resorcinols, which had previously been described to contribute to off-flavour in wheat bran, along with known off-taste compounds fatty acids as well as fatty acid oxidation products were identified to be key contributors to off-taste as well, exhibiting taste threshold between 12 and 981 µmol/kg.
Keywords: Sensomics approach; Dietary fibres; Bitter; Astringent; Taste dilution analysis; Alk(en)yl resorcinols; Fatty acid oxidation products
| 1. Introduction | ▴Top |
Wheat bran consumption, as for all whole grains, has been widely recognized as beneficial to health, as supported by numerous studies which demonstrated the inverse association between whole grain intake and risk of CHD as well as type 2 diabetes mellitus effects against cancer (Heiniö et al., 2008; Liu et al., 1999; Liu et al., 2000; Liu et al., 2012; Stevenson et al., 2012). Protective effects have largely been linked to phenolic compounds and dietary fibres which are mainly located in the bran layer of the wheat kernel and are made up of predominantly insoluble fibre (Belitz et al., 2001; Liu et al., 2000), as compared to soluble fibre, as well as phenolic acids, lignans and flavonoids (Belitz et al., 2001; Ferguson and Harris, 1999; Stevenson et al., 2012). The proposed protective effects of insoluble fibre (Belitz et al., 2001; Slavin et al., 1999), has, for example, been attributed to the binding and dilution of bile acids, cell proliferation promoters, through increased fecal bulk and shorter interactions of mutagens with the intestines by faster transit times (Slavin et al., 1999; Stevenson et al., 2012). Phenolic compounds found in the bran fraction of the wheat kernel, such vitamine E and ferulic acid, have shown various inhibitive effects against carcinogenic acids and protection against oxidative damage (Slavin et al., 1999; Wattenberg, 1985).
Despite the vastly beneficial health effects, the overall consumption remains well below intake recommendations leading to efforts to increase whole grain incorporation in dietary consumption (Mobley et al., 2013; Stephen et al., 2017; Ross et al., 2017; Seal et al., 2016). However, the incorporation of wheat bran in food products remains a challenge as it often leads to decreased rheology by effecting, i.e. water absorption and swelling index as well as loss in sensory quality due to evoking bitterness and off-flavour (Challacombe et al., 2011; Laddomada et al., 2015).
It was therefore the objective of the present study to identify, quantify and sensorically elucidate the key off-taste compounds in wheat bran by applying the sensomics approach (Duggan et al., 2020; Gläser et al., 2020; Günther-Jordanland et al., 2016; Lainer et al., 2020; Singldinger et al., 2018). Through activity-guided fractionation, off-taste compounds are isolated, structurally elucidated and quantified by mass spectrometry as well as 1D/2D NMR experiments and subsequently sensorically characterized to determine their contribution to off-taste in wheat bran.
| 2. Materials and methods | ▴Top |
2.1. Chemicals and materials
The following chemicals/compounds were obtained commercially: acetonitrile, methanol (HPLC-grade, J.T. Baker, Deventer, Netherlands), ethyl acetate, n-pentane (VWR prolabo chemicals, AnalaR Normapur, France), formic acid, ethanol (Merck, Darmstadt, Germany), acetonitril, methanol, i-propanol (LC-MS-grade, Honeywell, Seelze, Germany), toluene, p-toluene sulfonic acid monohydrate, 1-hexadecanol, 1-octadecanol, Z-9-dodecen-1-ol, molecular sieve (4 Å), palmitic acid (1), stearic acid (2), oleic acid (3), linoleic acid (4), linolenic acid (5), 5-heptadecyl-(9, Figure 1), 5-nonadecyl-(10, Figure 1), 5-heneicosyl-(11, Figure 1), 5-tricosyl-(12, Figure 1), 5-(nonadecyl-1,1,2,2-d4)resorcinol-(15, Sigma-Aldrich, Steinheim, Germany), E-9,10,13-trihydroxyoctadec-11-enoic acid (6), (10E,12Z)-9-hydroxyoctadec-10,12-dienoic acid (7), (9Z,11E)-13-hydroxyoctadec-9,11-dienoic acid (8, Larodan, Solna, Sweden), d14-azelaic acid (CDN Isotopes, Quebec, Canada). n-Pentane and ethyl acetate used for extraction were distilled twice prior to use. Water was purified by an Advantage A 10 water system (Millipore, Molsheim, France). For sensory analysis bottled water (Evian, Frankfurt am Main, Germany) was used. Potato fibres were provided by J. Rettenmaier & Söhne GmbH + Co KG. All commercial wheat bran fibres were purchased online.
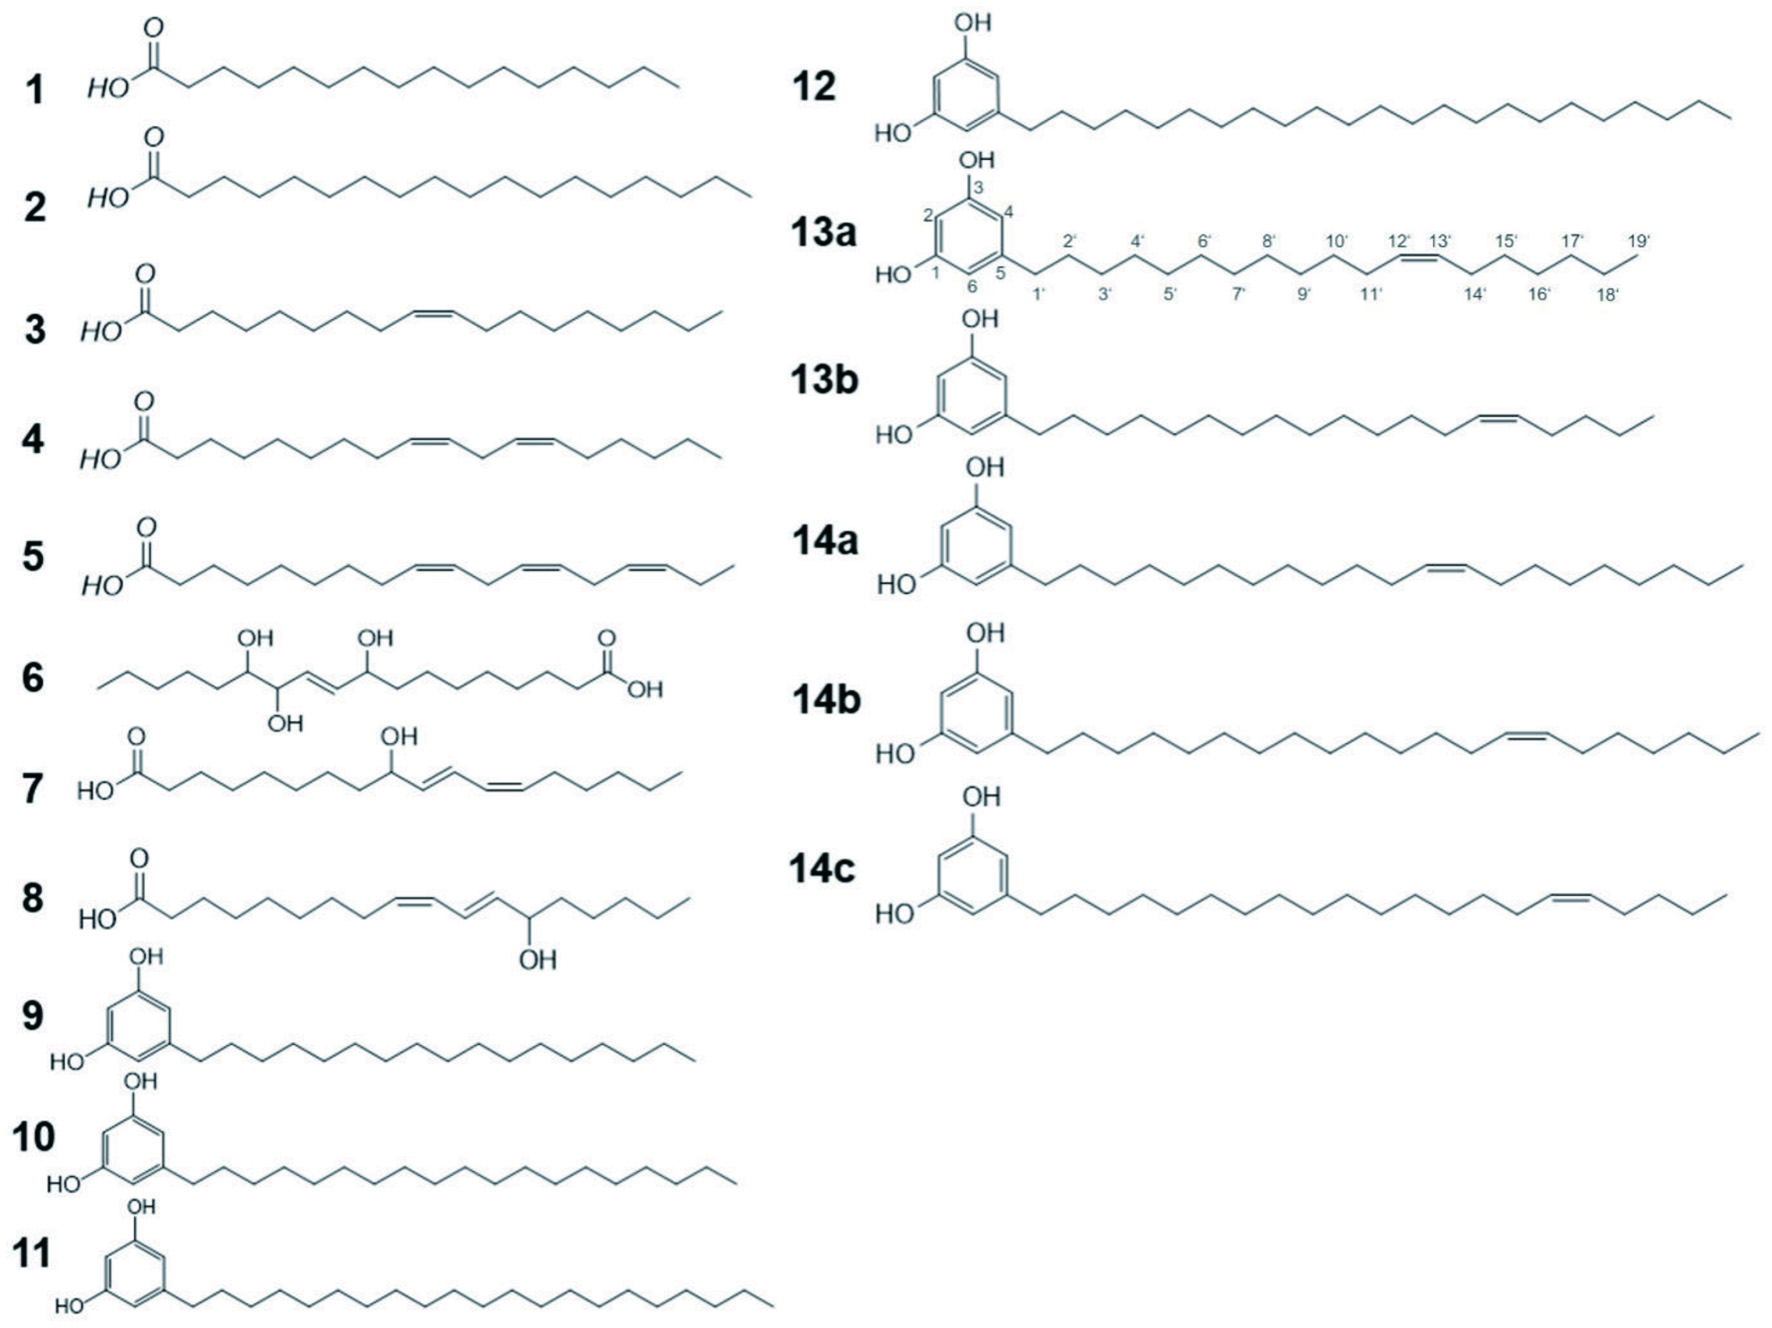 Click for large image | Figure 1. Compound structures. |
2.2. Sequential solvent extraction
Wheat bran fibre (300 g) was extracted with 2,5 L freshly distilled n-pentane (fraction A), ethyl acetate (fraction B), methanol/water (7/3, v/v) and methanol, respectively in an ultrasonic bath for 1 h at room temperature under stirring with each step repeated twice. The respective extracts were combined, and the solvent removed in vacuum at 40 °C. The methanol/water and methanol-extract were thus combined (fraction C), taken up in water (2 L) and again extracted thrice with 1 L n-pentane (added to fraction A) followed by three further extractions using ethyl acetate (added to fraction B). The corresponding extracts were combined with the previous extracts and the solvent removed in vacuum at 40 °C. The obtained fractions were lyophilized twice, the yield determined gravimetrically, and their taste profiles evaluated (Table 1)
 Click to view | Table 1. Taste profile analysis of wheat bran fibre and extracts |
2.3. Screening of known off-taste compounds in extracts by means of LC-TOF-MS and LC-MS/MS
To screen the obtained extracts for fatty acids and fatty acid oxidation products, known off-taste compounds in grains and seeds,(Duggan et al., 2020; Lainer et al., 2020) an aliquot (1 mg) of the respective fraction was dissolved in methanol (1 mL), membrane filtered and analyzed by LC-TOF-MS as well as LC-MS/MS allowing the identification of the below listed compounds:
- Palmitic acid, (1), LC-MS (ESI−) 255.3 [M-H]−; LC-MS/MS (DP = −80, CE = −12, CXP = −7 ): m/z 255.3, 255.0; LC-TOF-MS (ESI−) m/z 255.2322 [M-H] −.
- Stearic acid (2), LC-MS (ESI−) 283.4, 255.3 [M-H] −; LC-MS/MS (DP = −80, CE = −14, CXP = −17): m/z 283.4, 283.1; LC-TOF-MS (ESI−) m/z 283.2636 [M-H] −.
- Oleic acid (3), LC-MS (ESI−) m/z 281.3 [M-H] −; LC-MS/MS (DP = −100, CE = −38. CXP = −15): m/z 281.4, 281.1; LC-TOF-MS (ESI−) m/z 281.2477 [M-H] −.
- Linoleic acid (4): LC-MS (ESI−) m/z 279.3 [M-H] −; LC-MS/MS (DP = −85, CE = −14, CXP = −17): m/z 279.4, 279.1; LC-TOF-MS (ESI−) m/z 279.2323 [M-H] −.
- Linolenic acid (5): LC-MS (ESI−) m/z 277.3 [M-H]−; LC-MS/MS (DP = −80, CE = −14, CXP = −7): m/z 277.3, 277.3; LC-TOF-MS (ESI−) m/z 277.1819 [M-H] −.
- E-9,10,13-trihydroxyoctadec-11-enoic acid, (6); LC-MS (ESI−) m/z 329.4; LC-MS/MS (CV = 4, CE = 24, 22, 22): m/z 329.2, 329.3, 311.2, 229.1, 211.1; LC-TOF-MS (ESI−) m/z 329.2321 [M-H] −.
- (10E,12Z)-9-Hydroxyoctadec-10,12-dienoic acid; (7), LC-MS (ESI−) m/z 295.4 [M-H], LC-MS/MS (CV = 30, CE = 16): m/z 295.2, 171.0; LC-TOF-MS (ESI−) m/z 295.2268 [M-H] −.
- (9Z,11E)-13-Hydroxyoctadec-9,11-dienoic acid; (8); LC-MS (ESI−) m/z 295.4 [M-H]−, LC-MS/MS (CV = 2, CE = 17): m/z 295.2, 277.2, 195.2; LC-TOF-MS (ESI−) m/z 295.2268 [M-H] −.
2.4. Fractionation of wheat bran extract fraction B by means of medium-pressure liquid chromatography (MPLC)
An aliquot (1.02 g) of lyophilized fraction B was suspended in methanol/water (80/30, v/v) and fractionated by means of 150 × 40 mm i.d. polypropylene cartridge loaded with LiChroprep® RP-18 material (25-40 µm, Merck, Darmstadt, Germany). Fractionation was performed at a flow rate of 40 mL/min (binary pump module C-605, Büchi, Flawil, Switzerland) with water + 0.1% formic acid (FA) (solvent A) and methanol (solvent B) as mobile phases on a MPLC apparatus (Büchi) and ELSD detection (Sedex LT modul 80, Sedere, Alfortville, France) by means of a C-660 type fraction collector (Büchi). The following gradient was applied: 0 min, 50 % B; 5 min, 50 % B; 7 min, 70 % B; 12 min, 70 % B; 14 min, 90 % B; 19 min, 90 % B; 20 min, 100 % B; 40 min, 100 % B. Eleven fractions (B-I–B-XI) were collected, freed from solvent under vacuum at 40 °C, taken up in water to be lyophilized twice and analyzed by means of Taste Dilution Analysis (TDA).
2.5. Identification of key taste compounds in fraction B-XI
Fraction B-XI, which by means of TDA had been determined to demonstrate the greatest bitterness, was dissolved in methanol and after membrane filtration, injected onto a Nucleodur C18 Pyramid column (250 × 21.0 mm, 5 µm, Macherey-Nagel, Düren, Germany) equipped with a guard column of the same type. At a flow rate of 20 mL/min with 0.1 % FA in water (solvent A) and 0.1 % FA in a acetonitril/methanol-mixture (8/2, v/v; solvent B) as mobile phases, the solution was fractionated via ELSD-monitioring with the following gradient: 0 min, 90 % B; 2 min, 100 % B; 22 min, 100 % B; 25 min, 90 % B; 32 min, 90 % B. The nine fractions (B-XI-1–B-XI-9) were freed from solvent in vacuum at 40 °C and lyophilized twice prior to further use. The fractions were evaluated by TDA as well as analysed by means of 1D/2D-NMR and LC-TOF-MS for structural elucidation. LC-MS/MS fragmentation as well as comparison of retention times with reference compounds allowed the identification of key off-taste compounds 5-heptadecyl- (9), 5-nonadecyl- (10), 5-heneicosyl- (11), as well as 5-tricosylresorcinol (12). Aliquots of the obtained fractions were dissolved in methanol, membrane filtrated and analysed by means of LC/TOF-MS. As unsaturated alkyl resorcinols are also described in literature, (Heiniö et al., 2008; Lainer et al., 2020; Suzuki et al., 2014; Zitnak and Filadelfi, 1985) known alkenylresorcinols were also included in the analysis allowing the identification of compounds 13a/13b and 14a-c:
- 5-Heptadecylresorcinol, (9, Figure 1); LC-TOF-MS (ESI−) m/z 347.2582 [M-H]−; LC-MS/MS (CV = 28, CE = 28): m/z 347.4, 305.3.
- 5-Nonadecylresorcinol, (10, Figure 1); LC-TOF-MS (ESI−) m/z 375.3265 [M-H]−; LC-MS/MS (CV = 12, CE = 32): 375.2, 333.4; 1H-NMR (400 MHz, DMSO-d6), δ/ppm 0.9 [t, 3H, J = 7 Hz, H-C(19′)], 1.2 [m, 32H, H-C(3′-18′)], 1.5 [m, 2H, H-C(2′)], 2.4 [t, 2H, J = 7.8 Hz, H-C(1′)], 6.0 [s, 3H, H-C(2,4,6)]; 13C-NMR (400 MHz, DMSO-d6), δ/ppm 14.4 (C-19′), 22.6 [C-18′], 29.2 [C-3′], 29.4-29.5 [C-4′-16′], 31.2 [C-2′], 31.8 [C-17′], 35.8 [C1′], 100.4 [C-2], 106.7 [C-4, C-6], 144.7 [C-5], 158.6 [C-1, C-3].
- 5-Heneicosylresorcinol, (11, Figure 1); LC-TOF-MS (ESI−) m/z 403.3568 [M-H]−; LC-MS/MS (CV = 68, CE = 26): 403.2, 361.7; 1H-NMR (400 MHz, DMSO-d6), δ/ppm 0.9 [t, 3H, J = 7.0 Hz, H-C(19′)], 1.2 [m, 32H, H-C(3′-18′)], 1.5 [m, 2H, H-C(2′)], 2.4 [t, 2H, J = 8.0 Hz, H-C(1′)], 6.0 [s, 3H, H-C(2,4,6)]; 13C-NMR (400 MHz, DMSO-d6), δ/ppm 14.4 (C-21′), 22.5 [C-20′], 29.2 [C-3′], 29.4-29.5 [C-4′-18′], 31.2 [C-2′], 31.7 [C-19′], 35.7 [C1′], 100.4 [C-2], 106.7 [C-4, C-6], 144.7 [C-5], 158.7 [C-1, C-3].
- 5-Tricosylresorcinol, (12, Figure 1); LC-TOF-MS (ESI−) m/z 431.3888 [M-H]−; LC-MS/MS (CV = 6, CE = 34): 431.2, 389.5; 1H-NMR (400 MHz, DMSO-d6), δ/ppm 0.9 [t, 3H, J = 7.1 Hz, H-C(23′)], 1.2 [m, 32H, H-C(3′-22′)], 1.5 [m, 2H, H-C(2′)], 2.4 [t, 2H, J = 7.8 Hz, H-C(1′)], 6.0 [s, 3H, H-C(2,4,6)]; 13C-NMR (400 MHz, DMSO-d6), δ/ppm 14.4 (C-23′), 22.6 [C-22′], 24.3 [C-2′], 29.2 [C-3′], 29.4-29.5 [C-3′-21′], 35.7 [C1′], 100.5 [C-2], 106.7 [C-4, C-6], 144.6 [C-5], 158.8 [C-1, C-3].
- (Z)-5-Nonadec-12-enylresorcinol, (13a, Figure 1); LC-TOF-MS (ESI−) m/z 373.1834 [M-H] −; LC-MS/MS (CV = 12, CE = 32): 373.2, 331.4; 1H-NMR (500 MHz, DMSO-d6), δ/ppm 0.9 [t, 3H, J = 6.8 Hz, H-C(19′)], 1.2 [m, 32H, H-C(3′-10′), H-C(15′-18′)], 1.5 [2H, H-C(2′)], 2.0 [m, 4H, H-C(11′,14′)], 2.4 [t, 2H, J = 7.6 Hz, H-C(1′)], 5.3 [dt, 2H, J = 6, 10 Hz, H-C(12′,13′)], 6.1 [dd, 1H, J = 2.0 Hz H-C(4)], 6.2 [1s, 1H, H-C(2)]; 6.2 [1s, 1H, H-C(6)]; 13C-NMR (500 MHz, DMSO-d6), δ/ppm 14.6 (C-19′), 22.8 [C-18′], 28.3 [C-11′,C-14′], 29.1 [C-3′-C-9′C-16′], 29.4[C-10′,C-15′], 30.3 [C-2′], 32.9 [C-17′], 35.5 [C1′], 100.3 [C-2], 106.9 [C-4, C-6], 129.3 [C-12′,C-13′], 144.2 [C-5], 159.0 [C-1, C-3].
- (Z)-5-Nonadec-14-enylresorcinol, (13b, Figure 1); LC-TOF-MS (ESI−) m/z 373.1834 [M-H] −; LC-MS/MS (CV = 12, CE = 32): 373.2, 331.4; 1H-NMR (500 MHz, DMSO-d6), δ/ppm 0.9 [t, 3H, J = 6.8 Hz, H-C(19′)], 1.2 [m, 32H, H-C(3′-12′), H-C(17′-18′)], 1.5 [m, 2H, H-C(2′)], 2.0 [m, 4H, H-C(13′,16′)], 2.4 [t, 2H, J = 7.6 Hz, H-C(1′)], 5.3 [dt, 2H, J = 6, 10 Hz, H-C(14′,15′)], 6.1 [dd, 1H, J = 2.0 Hz, H-C(4)], 6.2 [1s, 1H, H-C(2)]; 6.2 [1s, 1H, H-C(6)]; 13C-NMR (500 MHz, DMSO-d6), δ/ppm 14.6 (C-19′), 22.8 [C-18′], 28.3 [C-13′,C-16′], 29.1 [C-3′–C-11′], 29.4[C-12′,30.3 [C-2′], 32.9 [C-17′], 35.5 [C1′], 100.3 [C-2], 106.9 [C-4, C-6], 129.3 [C-14′,C-15′], 144.2 [C-5], 159.0 [C-1, C-3].
- (Z)-5-Heneicos-12-enylresorcinol, (14a, Figure 1); LC-TOF-MS (ESI−) m/z 401.1623 [M-H] −; LC-MS/MS (CV = 68, CE = 26): 401.2, 359.7; 1H-NMR (500 MHz, DMSO-d6), δ/ppm 0.9 [t, 3H, J = 6.4 Hz, H-C(21′)], 1.30 [m, 32H, H-C(3′-10′), H-C(15′-20′)], 1.6 [m, 2H, H-C(2′)], 2.0 [m, 4H, H-C(11′,14′)], 2.4 [t, 2H, J = 7.8 Hz, H-C(1′)], 5.3 [dt, 2H, J = 6, 10 Hz, H-C(12′,13′)], 6.0 [dd, 1H, J = 2.0 Hz, H-C(4)], 6.1 [1s, 1H, H-C(2)]; 6.1 [1s, 1H, H-C(6)]; 13C-NMR (500 MHz, DMSO-d6), δ/ppm 14.6 (C-21′), 22.8 [C-20′], 28.0 [C-11′,C-14′], 29.1 [C-3′-C-10′,C-15′-C-18′], 30.1 [C-2′], 33.5 [C-19′], 35.2 [C-1′], 99.8 [C-2], 106.7 [C-4, C-6], 129.1 [C-12′,C-13′], 144.9 [C-5], 157.7 [C-1, C-3].
- (Z)-5-Heneicos-14-enylresorcinol, (14b, Figure 1); LC-TOF-MS (ESI−) m/z 401.1623 [M-H] −; LC-MS/MS (CV = 68, CE = 26): 401.2, 359.7; 1H-NMR (500 MHz, DMSO-d6), δ/ppm 0.9 [t, 3H, J = 6.4 Hz, H-C(21′)], 1.30 [m, 32H, H-C(3′-12′), H-C(17′-20′)], 1.6 [m, 2H, H-C(2′)], 2.0 [m, 4H, H-C(13′,16′)], 2.4 [t, 2H, J = 7.8 Hz, H-C(1′)], 5.3 [dt, 2H, J = 6, 10 Hz, H-C(14′,15′)], 6.0 [dd, 1H, J = 2.0 Hz, H-C(4)], 6.1 [1s, 1H, H-C(2)]; 6.1 [1s, 1H, H-C(6)]; 13C-NMR (500 MHz, DMSO-d6), δ/ppm 14.6 (C-21′), 22.8 [C-20′], 28.0 [C-13′,C-16′], 29.1 [C-3′-C-11′,C-18′], 29.4[C-12′,C-17′], 30.1 [C-2′], 33.5 [C-19′], 35.2 [C-1′], 99.8 [C-2], 106.7 [C-4, C-6], 129.1 [C-14′,C-15′], 144.9 [C-5], 157.7 [C-1, C-3].
- (Z)-5-Heneicos-16-enylresorcinol, (14c, Figure 1); LC-TOF-MS (ESI−) m/z 401.1623 [M-H] −; LC-MS/MS (CV = 68, CE = 26): 401.2, 359.7; 1H-NMR (500 MHz, DMSO-d6), δ/ppm 0.9 [t, 3H, J = 6.4 Hz, H-C(21′)], 1.30 [m, 32H, H-C(3′-14′), H-C(19′-20′)], 1.6 [m, 2H, H-C(2′)], 2.0 [m, 4H, H-C(15′,18′)], 2.4 [t, 2H, J = 7.8 Hz, H-C(1′)], 5.3 [dt, 2H, J = 6, 10 Hz, H-C(16′,17′)], 6.0 [dd, 1H, J = 2.0 Hz, H-C(4)], 6.1 [1s, 1H, H-C(2)]; 6.1 [1s, 1H, H-C(6)]; 13C-NMR (500 MHz, DMSO-d6), δ/ppm 14.6 (C-21′), 22.8 [C-20′], 28.0 [C-15′,C-18′], 29.1 [C-3′–C-13′], 29.4[C-14′], 30.1 [C-2′], 33.5 [C-19′], 35.2 [C-1′], 99.8 [C-2], 106.7 [C-4, C-6], 129.1 [C-16′,C-17′], 144.9 [C-5], 157.7 [C-1, C-3].
The positions of the double bonds within the unsaturated alkenyl resorcinoles 13a/b and 14a-c were determined after reductive cleavage by means of ozonolysis and analysis of the formed aldehydes by means of GC-MS. Ozone was generated by means of an ozone generator model 502 (Fischer, Bonn-Godesberg, Germany), operating at an oxygen flow of 200 L/h (purity, 5.0, Westfalen, Germany) and 75 W. The respective alkenyl resorcinols were dissolved in dichlormethane (50 mL) and cooled to −78 °C after which ozone was added until the reaction mixture turned blue. After the removal of excess ozone by applying a stream of nitrogen, dimethyl sulfide was added and the solution continuously stirred at room temperature. Afterward, the solvent was removed under vacuum at 40 °C, the residue taken up in methanol and the solution used for GC-MS analysis which led to the identification of pentanal and heptanal for compound 13a/b and pentanal, heptanal and nonanal for compound 14a-c which conforms with works by Suzuki et al. (Suzuki et al., 2014).
2.6. Analytical sensory analyses
2.6.1. Sensory Panel Training
The sensory panel consisted of 27 panelists (12 females and 15 males, 23-32 years old), who had given informed consent to participate in the sensory studies and had no history of known taste disorders. All panelists were trained with reference taste compounds on a weekly basis for at least a year prior to the sensory studies to familiarize themselves with the used sensory methodologies and be able to differentiate taste qualities. All sensory analyses were performed in a sensory panel room at 22-25 °C using a nose clip to avoid cross-model interactions with odorants.
2.7. Pretreatment of food fractions and compounds
Prior to sensory analyses all fractions and isolated compounds were suspended in water and lyophilized twice.
2.8. Taste Profile Analysis
Wheat bran (10 g) was suspended in bottled water (100 mL) and stirred for 2 hours. The slurry was presented to the trained panel to evaluate the bitter, astringent, sweet, salty, sour and burning taste perceptions on a linear intensity scale from 0 (not detectable) to 5 (strongly detectable). Additionally, aliquots of fractions A, B and C were taken up in bottled water (1 % EtOH, pH 5.9) according to their natural concentrations and presented to the panel to evaluate the taste intensities.
2.9. Taste Dilution Analysis
(Frank et al., 2001; Scharbert et al., 2004; Singldinger et al., 2018) Aliquots of the respective MPLC- and HPLC-fractions were taken up in bottled water (1 % EtOH, pH 5.9) in their natural concentration ratios, sequentially diluted 1:1 and presented to the panel in ascending concentrations with a control sample (bottled water, 1 % EtOH). The panelists were asked to place an aliquot of both samples on either the right or left side of the tongue and mark the sample dilution step at which they were first able to detect a difference from the control sample (bottled water, 1 % EtOH). The dilution step at which panelists could detect a taste difference between the diluted sample and a blank (water), was defined as the TD-factor.
2.10. Human Taste Recognition Threshold analysis
Taste recognition thresholds were determined as previously reported in literature (Dawid et al., 2012; Frank et al., 2001; Scharbert and Hofmann, 2005). Compounds were dissolved in ethanol in defined concentrations and sequentially diluted 1:1 with ethanol. The panelists were subsequently asked to identify the sample dilution step at which they were first able to discern any bitterness or astringency. The taste recognition threshold was determined as the geometric mean of the first correctly identified concentration and the last falsely identified concentration. The total taste recognition threshold was determined as the geometric mean of individual taste thresholds.
2.11. LC-MS/MS quantitation and method validation
2.11.1. Alkyl resorcinols
To quantitate the identified alk(en)yl resorcinols, the respective reference compounds (9/10/11/12/13a/b/14a-c) were directly infused into the MS-System (System 1) and all specific compound ionization parameters and source parameters optimized for optimal analyte detection. Characteristic ion transitions were selected and are depicted in Table 2. Alkenyl resorcinols isomers 13a/b and 14a-c were quantified as isomeric mixtures.
Click to view | Table 2. MRM transitions of alk(en)yl resorcinols |
2.11.2. Calibration
For quantitation, the compounds 9-12 were mixed with constant levels of the internal standard d4-5-nonadecylresorcinol (15) in ten ratios from (0.02–30 µg/mL in methanol), vortexed and analyzed by means of UPLC-MS/MS in triplicates. Calibration curves for each compound were obtained by plotting peak areas of analytes to internal standards against concentrations of the respective analyte to the internal standard using linear regression. The corresponding equations were y = 0.3588x − 0.0899 (9/15; R2 = 0.9927), y = 0.108x-0.0443 (10/15; R2 = 0.9950), y = 0.0806x − 0.0074 (11/15; R2 = 0.9983) and y = 0.02165x − 0.0167 (12/15; R2 = 0.9983).
Compounds 13a/b and 14a-c were analyzed by means of external calibration by dissolving the compounds in methanol, respectively, obtaining nine concentration levels in concentration ranges between 0.11 to 63 µg/L which were analyzed by LC-MS/MS. The calibration curves were acquired by plotting peak areas of the analytes against the concentrations of the respective calibration level using linear regression. The calibration curve of the compounds were as follows: y = 1E+10x – 6E+06 (13a/b; R2 = 0.9993) and y = 2E+10x – 9E+06 (14a-c; R2 = 0.9994).
2.11.3. Development of extraction procedure
To achieve a complete extraction of the targeted analytes, the wheat bran fibres were extracted with methanol three to six times, respectively. Furthermore, batches of fibres were extracted three times with either methanol set to pH 3 with formic acid, methanol at pH 5 or methanol without pH adjustment. Sample preparation was performed as described below, the respective supernatants combined, filled up to a volume of 100 mL, an aliquot (1,000 µL) spiked with constant amounts of internal standard (10 µL; 1.1 mg/mL) and analyzed by means of UPLC-MS/MS.
2.11.4. Sample Preparation
A batch of wheat fibre (ca. 1 g) was placed in a bead beater (CK28_15 mL, Precellys Homogenizer, Bertin Technologies) and methanol (10 mL) added. The extractive grinding was performed thrice at 6,500 rpm for 30 s. The suspension was centrifuged for 10 min (4.4 krpm) and the supernatant placed in a flask. Methanol (5 mL) was added to the residue, the extraction repeated twice as described above and the supernatant filled up to 100 mL with methanol. An aliquot (1,000 µL) was, in case of alkyl resorcinols spiked with constant amounts (10 µL; 1.1 mg/mL) of the internal standard stock solution (15) and vigorously shaken for five minutes and alk(en)yl resorcinols analyzed by means of LC-MS/MS.
2.11.5. Recovery
The recovery of the UPLC-MS/MS method was determined by standard addition. Aliquots of wheat bran fibre extracts obtained as reported above were spiked with three different concentrations (3, 5, 13 µg/mL) of the respective analyte (9-12) as well as constant levels (10 µL; 1.1 mg/mL) of internal standard (15). A reference sample of the same batch was also spiked with internal standard and served as the control sample. The samples were vigorously shaken for 5 min and subsequently analyzed by means of UPLC-MS/MS. There were no recovery experiments performed for compounds 13a/b and 14a-c.
2.11.6. Intraday precision
Five aliquots of wheat bran fibre extracts were analyzed for 9-12 in triplicates on consecutive days. The precision of the developed method was expressed by relative standard deviation (%). There were no precision experiments performed for compounds 13a/b and 14a-c.
2.11.7. Limits of detection (LOD)/limits of quantitation (LOQ)
To determine LOD and LOQ, methanol was spiked with decreasing concentrations of analytes 9-12/13a/b/14a-c. LOD and LOQ were determined as the concentrations for which signal-to-noise ratio were 3 and 10, respectively, via LC-MS/MS on System 1.
2.11.8. Fatty acids and fatty acid oxidation products
Quantitation was performed according to Duggan et al. (Duggan et al., 2020) and Lainer et al. (Lainer et al., 2020) on System 2 and sample preparation was performed as described above.
2.11.9. High performance liquid chromatography (HPLC)
Preparative analysis was performed on a HPLC apparatus (Jasco, Groß-Umstadt, Germany) comprised of a binary high-pressure two PU-2087 plus pump system, a Degasys DG-1310 (Uniflows, Tokyo, Japan) degasser unit with a Sedex LT-ELSD 85 (Sedere, Alfortville, France) serving as a detector and a Rheodyne Rh 7725i injection valve (Rheodyne, Bensheim, Germany). Chrompass Chromatography Data System, Version 1.9. (Jasco) was applied for data acquisition.
2.11.10. UPLC/time-of-flight mass spectrometry (LC/TOF-MS)
A Waters Synapt G2-S HDMS spectrometer (Waters, Manchester, Great Britain) coupled to an Acquity UPLC Core System (Waters, Bedford, MA, USA) was used to obtain high resolution mass spectra. Measurements were performed in negative mode (ESI−) with obtained data being lock mass corrected to leucine enkephaline (m/z 556.2771 [M+H]+) and applying the following parameters: capillary voltage (2.0 kV), source temperature (150 °C), desolvation temperature (450 °C), cone gas flow (5 L/Hr), desolvation gas flow (850 L/Hr). The system was equipped with a BEH C18 column (2.1 × 150 mm, 1.7 µm) and mobile phases 0.1 % FA in water (solvent A) and methanol (solvent B). Separation was performed with a flow rate of 0.3 mL/min and the following gradient: 0 min, 40 %B, 10 min, 100 % B, 18 min, 100 % B, 19 min, 40 % B, 20 min, 40 % B. Data acquistion and analysis was performed by means of MassLynx software (Version 4.1 SCN 851, Waters).
2.11.11. High performance liquid chromatography/tandem mass spectrometry (LC-MS/MS)
2.11.11.1. System 1
Quantitation of alkyl resorcinols/fatty acid oxidation products was performed on a Xevo TQ-S mass spectrometer (Waters, Manchester, Great Britain) coupled with an Acquity UPLC Core system (Waters) using a Acquity UPLC® BEH C18 column (150 × 2.1 mm, 1.7 µm; Waters, Milford, USA) at a flow rate of 0.3 mL/min. Data aquisition and subsequent processing were performed with MassLynx v4.1 SCN 851 software (Waters, Manchester, Great Britain). Alkylresorcinols: Chromatography was performed with a mobile phase consisting of water +0.1 % FA (solvent A) and methanol +0.1 % FA (solvent B), applying the following gradient: 0 min, 80 % B; 7 min, 100 % B; 20 min, 100 % B; 20.5 min, 80 % B; 22 min, 80 % B. The mass spectrometer was run in multiple reaction monitoring (MRM) mode in negative electrospray ionization (ESI−) with the following insource parameters: capillary voltage (-2.0 kV), sampling cone 20 V, source temperature (150 °C), desolvation temperature (500 °C), cone gas flow (150 L/Hr) and desolvation gas flow (800 L/Hr). Fatty acid oxidation products/fatty acids: Quantitation of these compounds were performed according to Duggan et al. (Duggan et al., 2020).
2.11.11.2. System 2
Quantitation of fatty acids was performed on an API Qtrap triple-quadrupol/linear ion trap mass spectrometer (AB Sciex, Darmstadt, Germany) coupled with a Dionex UHPLC UltiMate 3000 system (Dionex, Idstein, Germany) as described (Duggan et al., 2020). Separation was performed by means of a Polar RP column (100 × 2.0 mm, 2.5 µm, Phenomenex, Aschaffenburg, Germany). The mobile phase was prepared as follows: 5 mM NH4Ac-buffer was diluted 1/50 in water, set to pH 5.0 with actetic acid and mixed with ACN/i-Propanol (5/55/40, solvent A) and water (9/95, solvent B). The gradient, with a flow rate of 0.4 mL/min, was set to the following: 0 min, 50 % B; 2 min, 50 % B; 4 min, 0 % B; 11 min, 0 % B; 12 min, 50 %B; 17 min, 50 % B. The mass spectrometer was operated in multiple reaction monitoring mode (MRM) in negative Mode (ESI−) with the following insource parameters: curtain gas (25 psi), temperature (550 °C), gas 1 (55 psi), gas 2 (65 psi), collision actived dissociation (-2 V) and entrance potential (-10 V).
2.11.12. Gas chromatography-mass sepctrometry (GC-MS)
A Trace GC Ultra chromatograph was coupled to a single quadrupole ISQ mass spectrometer (Thermo Fisher Scientific, Dreieich, Germany) equipped with a GC PAL autosampler (Chromtech, Bad Camberg, Germany) and a PTV injector (Thermo Fisher Scientific). An aliquot was injected at a base temperature of 40 °C and raised at 12 °C/sec to 60 °C which was held for 0.5 min and then increased by 10 °C/s to 240 °C, held for 1 min. The carrier gas was helium at a constant flow of 1.20 mL/min and the splitflow set to 24 mL/min. The oven was equipped with a DB-1701 column (30 m × 0.25 mm i.d., 0.25 µm film (Agilent, Waldbronn, Germany)). The initial oven temperature was 40 °C, held for 2 min followed by a temperature gradient of 10 °C/min. The final temperature of 240 °C was held for 3 min. Mass spectra were generated using electron ionization mode (EI) at 70 eV with a scan range of m/z of 40–300 and the data evaluated using Xcalibur 2.0 software (Thermo Fisher Scientific).
2.11.13. Nuclear magnetic resonance spectroscopy (NMR)
1D/2D-NMR spectra were measured on a 500 MHz Avance spectrometer (Bruker, Rheinstetten, Germany) equipped with a cryo-TCI probe (300 K, Bruker). Samples were either dissolved in MeOD-d4 or DMSO-d6 and chemical shifts are reported in parts per million (ppm) relative to solvent signals in the 1H NMR and 13C NMR spectra. Solvent signals for DMSO-d6 are as follows: 1H NMR 2.50 ppm, 3.33 ppm; 13C NMR 39.52 ppm. Solvent signals for MeOD-d4 are as follows: 1H NMR 3.31 ppm, 4.87 ppm; 13C NMR 49.00 ppm. TopSpin NMR software (Version 3.2, Bruker) as well as MestReNova 11.0.1 (Mestrelab Research, Santiago de Compostela, Spain) were used for data processing.
| 3. Results and discussion | ▴Top |
To identify the key off-taste compounds in wheat bran fibre, the fibre material was stirred in bottled water and analyzed by means of taste profile analysis. The slurry was evaluated by a trained sensory panel and asked to evaluate the taste intensities of the taste attributes bitter, astringent, sweet, salty, sour and burning taste perceptions on a linear intensity scale from 0 (not detectable) to 5 (strongly detectable) by comparison to a reference solution of a previously evaluated potato fibre solution (Duggan et al., 2020). The suspension exhibited a clear bitter and astringent taste profile with values of 1.9 and 1.5 for bitterness and astringency, respectively. Sweetness (0.7), saltiness (0.3), sour (0.9) and burning sensation (0.4) were rated as less intense. The wheat bran fibres were consequently subjected to a sequential solvent extraction to further isolate and elucidate off-taste compounds.
3.1. Sequential solvent extraction of wheat fibre
The wheat bran fibre was sequentially extracted to yield three extracts of n-pentane (fraction A), ethyl acetate (fraction B) and the combined extracts of methanol/water and methanol (fraction C). The obtained fractions were dissolved in their natural concentrations and evaluated by a trained panel for bitterness and astringency. Fraction B was evaluated as most bitter (1.7) and astringent (1.3), while fraction A (bitterness 1.0, astringency 1.1) and fraction C (bitterness 1.1, astringency 0.9) exhibited less intense off-taste (Table 1). To further isolate the most intense off-taste compounds, fraction B was therefore further fractionated and analyzed by means of taste dilution analysis.
3.2. Sensory guided fractionation of fraction B
Bitter and astringent tasting fraction B was further fractionated by means of MPLC-ELSD equipped with a RP-18 stationary phase yielding eleven fractions (B-I to B-XI). The fractions were freed of solvent, lyophilized and presented to a trained panel as a taste dilution analysis (Figure 2). With TD-factors of 5 and 6 for bitterness and astringency, respectively, Fraction B-XI exhibited the greatest overall off-taste seconded by fractions B-V and B-II in bitterness while the latter also evoked a strong astringent sensation. Therefore, further studies on off-taste compounds focused on these fractions.
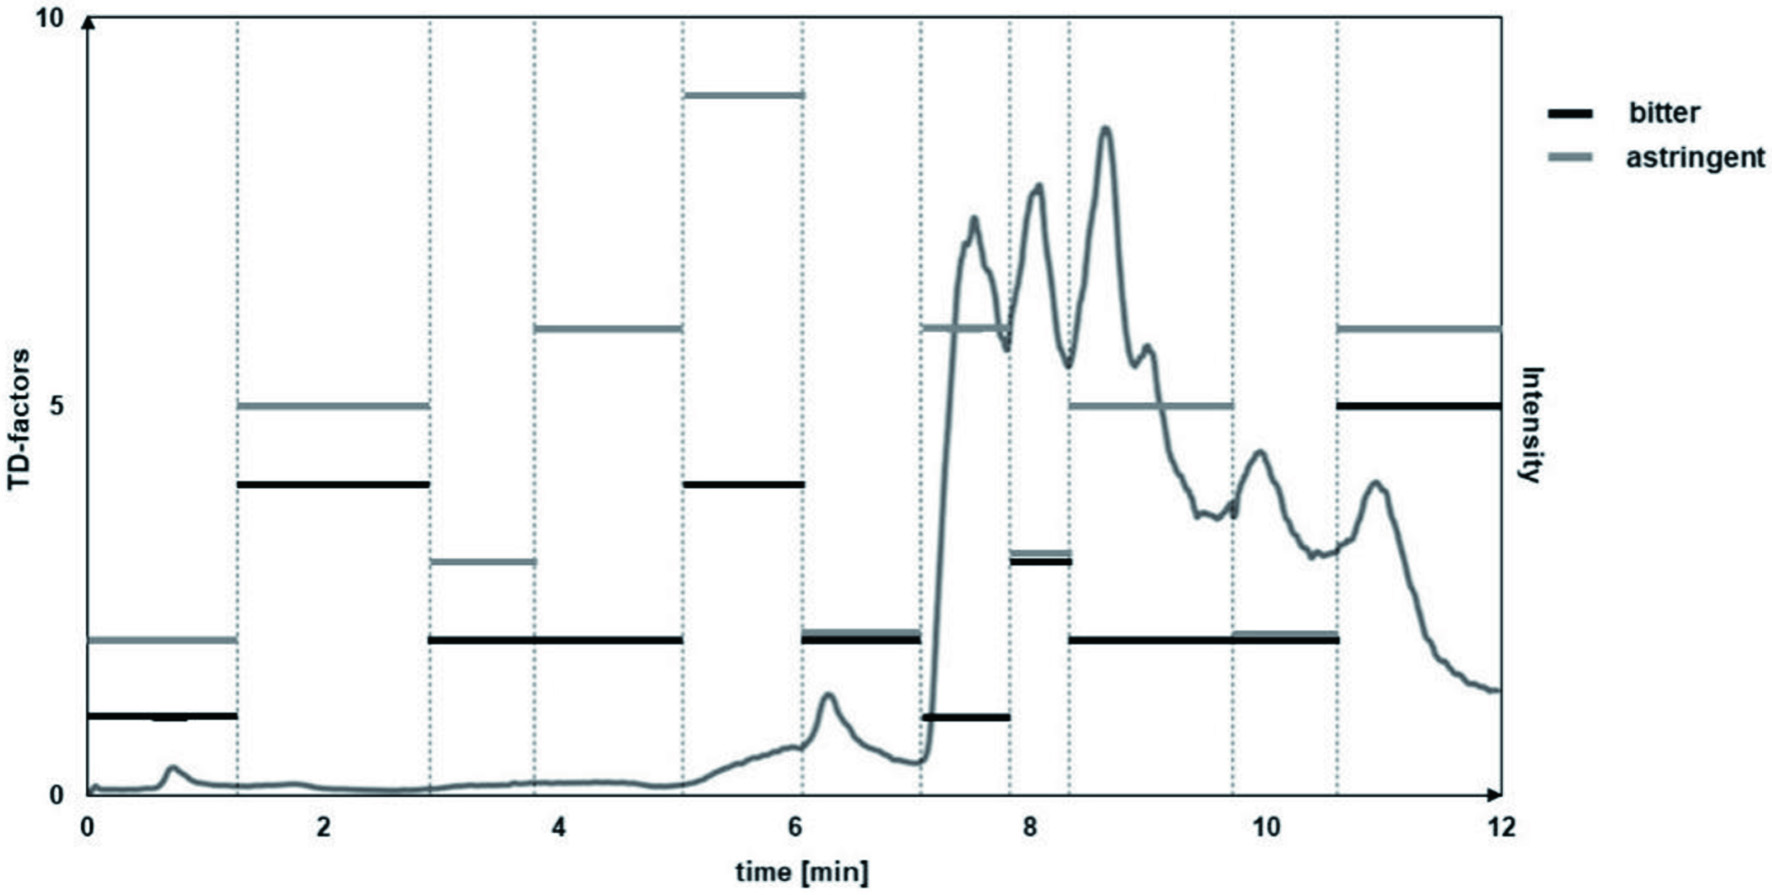 Click for large image | Figure 2. MPLC chromatogram with collected fractions and determined TDA values. |
To further isolate the most bitter taste compounds, fraction B-XI was fractionated by means of HPLC equipped with RP-18 phase material and ELSD monitoring obtaining nine fractions. The fractions were freed of solvent, lyophilized and again analyzed by means of taste dilution analysis (Figure 3). Fraction B-XI-7 was perceived as intensely bitter and astringent, with TD-factors of 8 and 14, respectively while Fraction B-XI-6 also demonstrated a strong bitterness. The compounds were identified to be alkyl resorcinols 5-heptadecyl- (9, Figure 1), 5-nonadecyl- (10, Figure 1), 5-heneicosyl- (11, Figure 1) and 5-tricosylresorcinol (12, Figure 1) by means of 1D/2D NMR experiments. The 1H NMR spectra of each compound displayed a proton signal at 2.4 ppm demonstrating a vicinal coupling to proton signals at 1.5 ppm with an additional coupling to a large aliphatic chain moiety at 1.2 ppm. A distinctive singlet resonating at 6.0 ppm of three proton signals which displayed vicinal coupling with the proton signal resonating at 2.4 ppm in the COSY experiment while exhibiting a carbon resonance at both 100.4 ppm and 106.7 ppm in HMBC experiments, indicated a highly symmetrical compound moiety. Quaternary olefinic carbon atoms assigned to signals 144.7 ppm as well as 158.7 allowed the identification of an aromatic ring which, by long-range heteronuclear correlation of quaternary carbon atom at 144.7 ppm to proton signals at 1.5 ppm and 2.4 ppm, respectively, displayed a direct connection to the aliphatic chain moiety (Figure 4). The compounds could be confirmed via LC-TOF-MS screenings of the respective fractions which displayed pseudomolecular ions m/z 347.2582 [C23H39O2]−, m/z 375.3265 [C25H43O2]−, m/z 403.3568 [C27H47O2]−, m/z 431.3888 [C29H51O2]− and comparison of retention times with standard material. Through both the distinctive NMR and LC-MS/MS fragmentation pattern, the alkyl resorcinols 9-12, 13a/b, and 14a-c (Figure 1) could be identified which have previously been described in grain products and were confirmed through co-chromatography (Dawid et al., 2012; Lainer, 2019; Scharbert and Hofmann, 2005; Zitnak and Filadelfi, 1985). In Fraction B-XI-5, moreover, in addition to the distinctive NMR pattern displayed in the alkyl resorcinols, the presence of a double bond in the alkyl chain could be identified attributed to a proton signal at 5.3 ppm with a coupling constant of both a 6 and 10 Hz indicating an E configuration. The signal displayed correlation to proton signal at 2.00 ppm which was shown connected to the alkyl chain moiety through COSY and HMBC experiments. Through applying ozonolysis, the positions of the double bonds could be identified by determining pentanal and heptanal for 13a/b and in the case of 14a-c nonanal, as well.
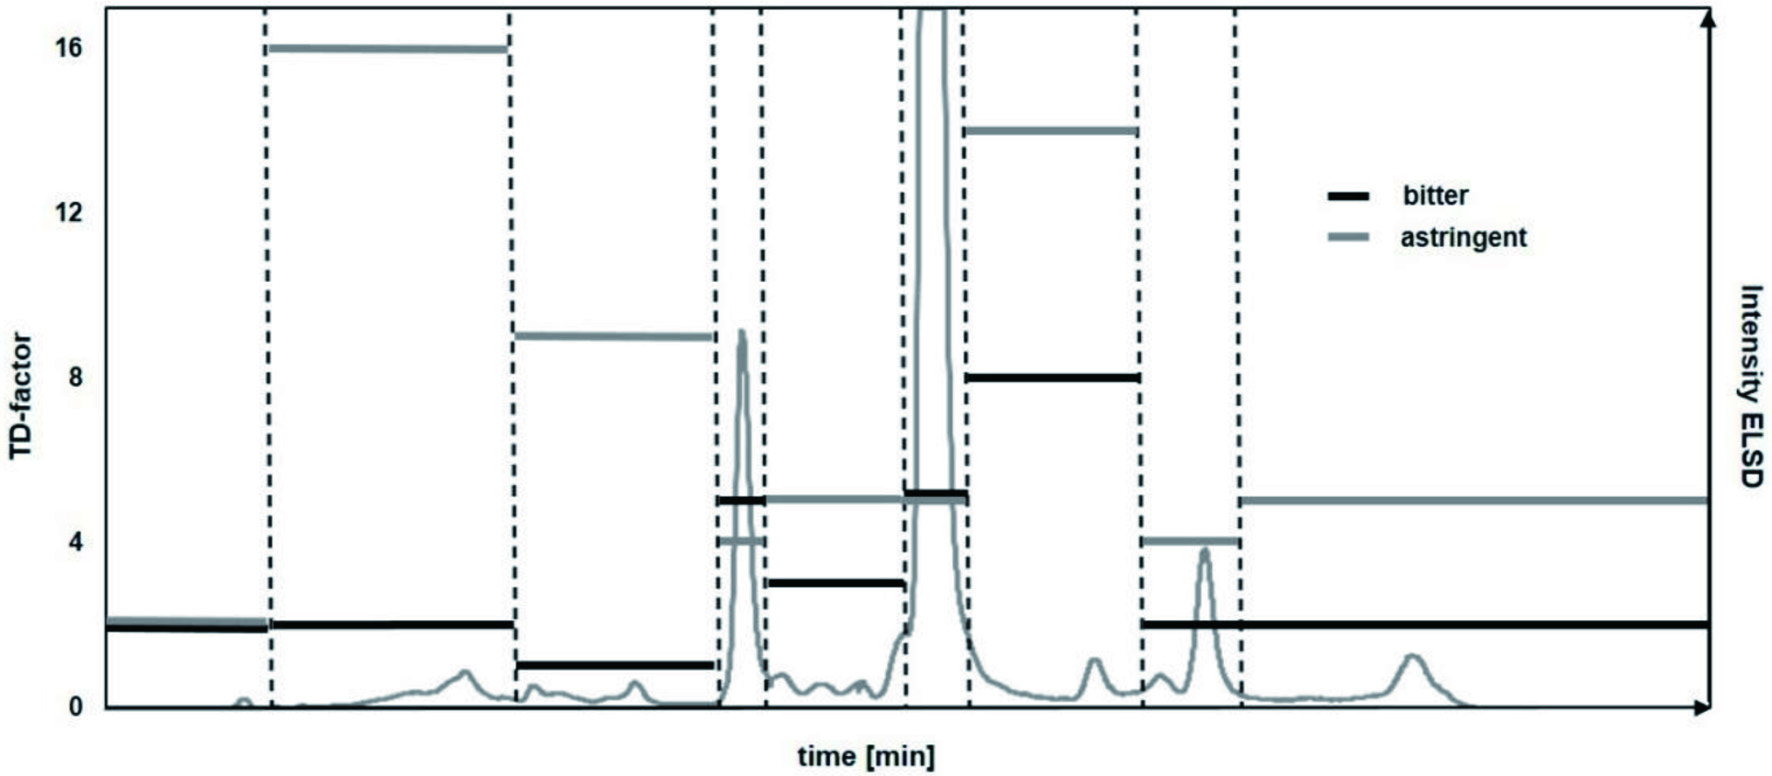 Click for large image | Figure 3. HPLC chromatogram with collected fractions and determined TDA values. |
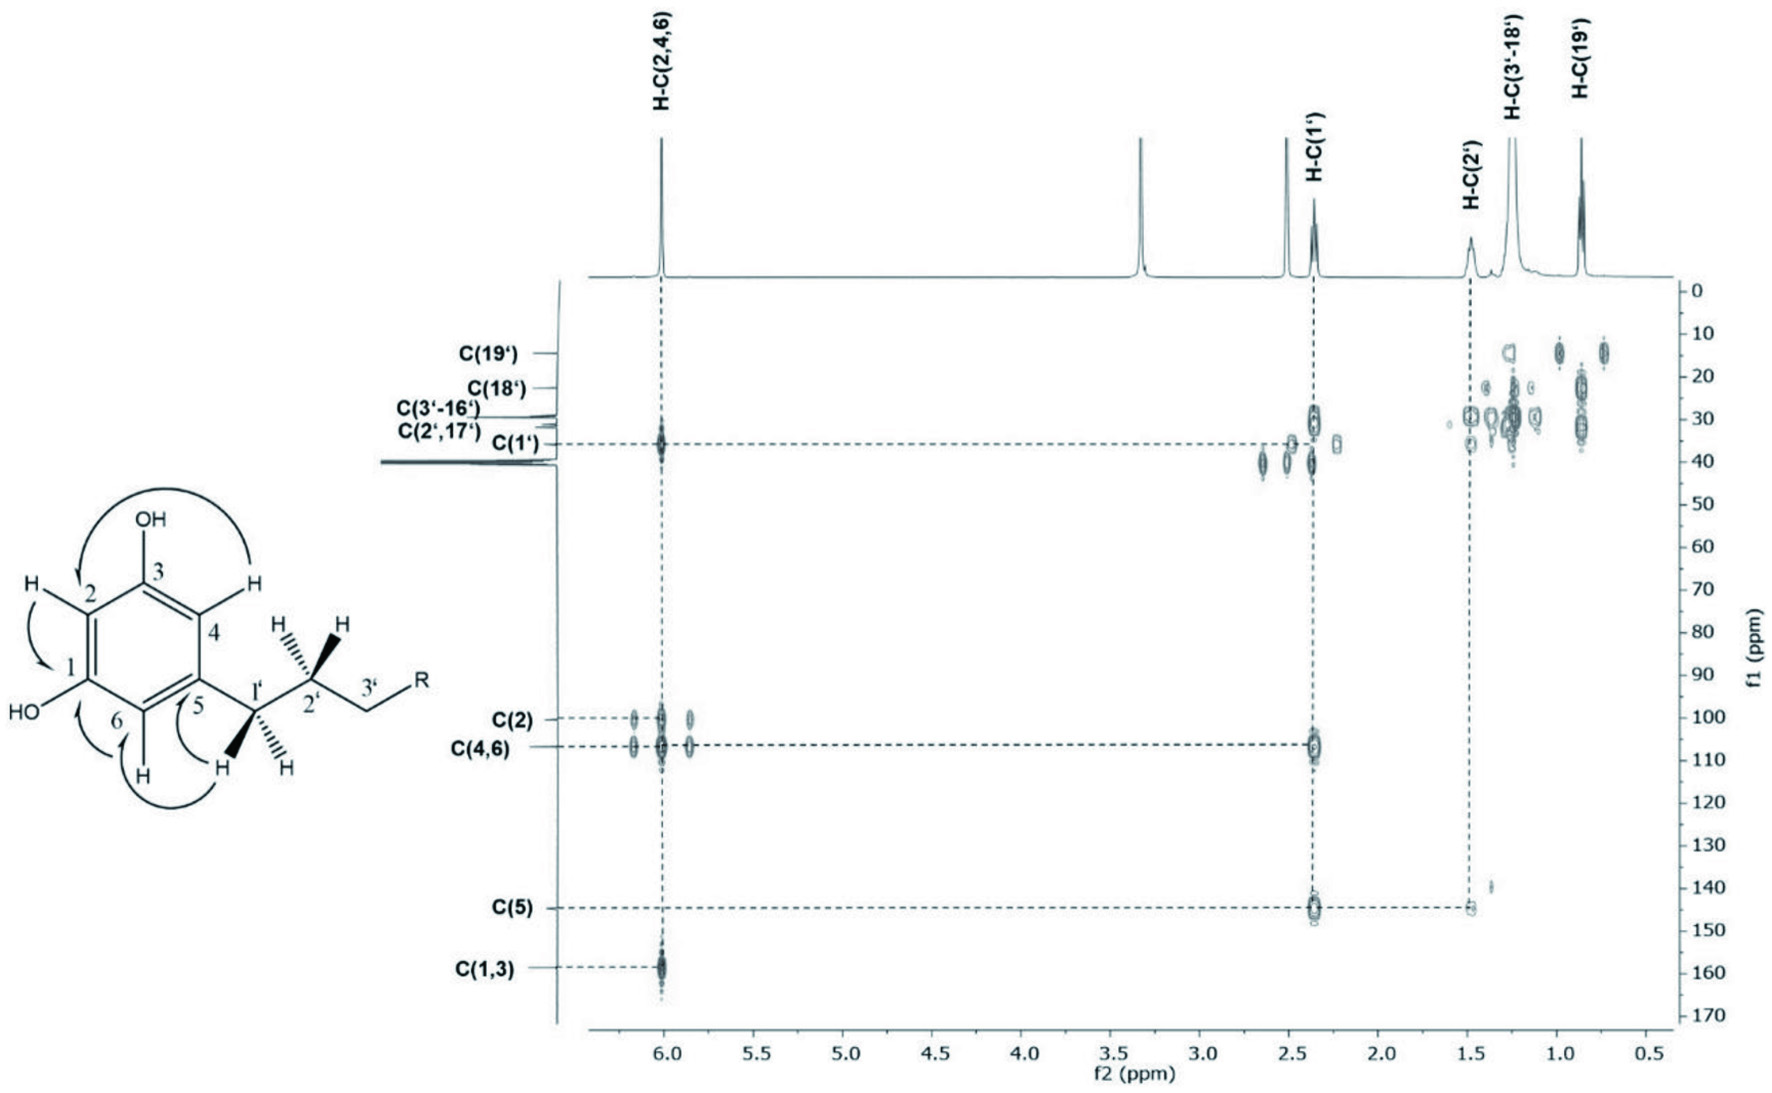 Click for large image | Figure 4. Excerpt of HMBC NMR experiment of distinctive singlet of alkyl resorcinols resonating at 6.01 ppm. |
3.3. Sensory evaluation of alkyl resorcinols 9-14a-c and taste thresholds of identified off-taste compounds
The commercially obtained alkyl resorcinols were evaluated by means half-mouth test to determine their taste recognition threshold and determine their contribution to the perceived off-taste in wheat bran fibres. The analytes 9-11 were shown to be potent off-taste compounds, displaying taste recognition threshold between 12-47 µmol/L for bitterness and astringency (Table 2).
For compounds 12, 13a/b and 14a-c, panelists assessed them as either bitter, astringent or both. Therefore taste recognition thresholds were determined as one for both bitter and astringent, with thresholds for compounds 12, 13a/b and 14a-c being determined as 57, 86 and 255 µmol/L, respectively (Table 2).
Taste thresholds for identified off-taste compounds fatty acids and fatty acid oxidation products were taken from literature (Table 3) (Chen et al., 2004; Lainer et al., 2020; Mattila et al., 2005). Fatty acid compounds 1-5 are described as tasting bitter as well as evoking an scratchy taste sensation with taste recognition thresholds ranging between 807 and 981 µmol/L. Fatty acid oxidation products 6-8 are known bitter compounds with taste recognition thresholds of 80, 354 and 787 µmol/L, respectively (Lainer, 2019; Lainer et al., 2020).
Click to view | Table 3. Concentration, standard deviation, taste quality, taste recognition thresholds [µmol/kg] and dose-over-threshold-factors (DoT) |
3.4. LC-MS/MS method development and validation
To quantify and estimate the contribution of the identified off-taste compounds 9-14a-c to the perceived off-taste in wheat bran fibres, an extraction method was first optimized, and a LC-MS/MS quantitation method developed and validated. Therefore, each analyte was infused into the mass spectrometer by a syringe pump to evaluate specific product ions of the respective pseudomolecular ions. All parameters were thus optimized to obtain specific and abundant ion transitions. For calibration of the method, compounds 9-12 were mixed in ten ratios with constant levels of internal standard while for compounds 13a/b and 14a-c nine standard solutions were used to ensure linearity in the calibrated range. To determine the impact of the pH value on the extraction, the extraction process was performed with either methanol, methanol at pH 5.0 or methanol set to pH 3.0. with formic acid. The results obtained by LC-MS/MS analysis showed no or only moderate influence on quantitative results of compounds 9-12 in samples which had been extracted at pH values set to 5.0 (9/15 ± 4.6%; 10/15 ± 16 %; 11/15 ± 33 % 12/15 ± 28 %; 13a/b ± 0.78 %; 14a-c ± 11 %) or 3.0 (9/15 ± 10 %; 10/15 ± 6 %; 11/15 ± 8.7 % 12/15 ± 13 %, 13a/b ± 2.1 %; 14a-c ± 2.0 %) whereas results of samples extracted with methanol were shown to be stable (9/15 ± 10.3%; 10/15 ± 6.1 %; 11/15 ±9.3 % 12/15 ± 9.6 %; 13a/b ± 10 %; 14a-c ± 2.0 %). To provide complete extraction of all analytes, the extraction process was repeated three, four, five and six times as described above. Complete extraction is achieved after four extractions with quantitative results showing no further increase after this step. The trueness of the method was determined by spiking the wheat bran material with three different concentrations (2.5 µg/mL, 5 µg/mL, 15 µg/mL) of analytes 9 to 12 prior to analysis and determining the recovery. The average recovery of the respective analytes were as follows: 97.4 % for 9; 97.6 % for 10; 99.9 % for 11; 83.4 % for 12. Due to lack of material, no recovery experiments could be performed for compounds 13a/b and 14a-c.
The precision of the method was determined by analysing aliquots of extracted wheat bran fibres twice within one week. The precision, expressed by the relative standard deviation is 18 % for 9, 9.5 % for 10, 19 % for 11 and 12 % for 12.
Limits of detection (LOD) and limits of quantitation (LOQ) were calculated as described above. Limits of detection were determined to range between 0.014 mg/L to 0.018 mg/L and limits of quantitation between 0.030 mg/L and 0.061 mg/L for compounds 9-14a-c in calibration standards, respectively.
3.5. Dose-over-threshold factors (DoT-factors) in wheat fibres
In order to determine the impact of the identified compounds to the perceived off-taste, the wheat fibres were extracted to obtain a total extract and compounds were quantified as reported. The contribution of the analytes to the off-taste are estimated by determining the dose-over-threshold factors which are calculated as the ratio of analyte concentration to the taste threshold concentrations (Scharbert et al., 2004). The results highlighted that fatty acids with the exception of stearic acid (2), the fatty acid oxidation product E-9,10,13-trihydroxyoctadec-11-enoic acid (6) as well as the identified alkyl resorcinols 9-12 and their unsaturated analogues 13a/b and 14a-c have a significant impact on the perceived off-taste, such as bitterness, astringency and the scratchy taste perception of wheat bran fibres, having DoT-factors of > 1. The identified alkyl resorcinols 5-nonadecylresorcinol (10) and 5-heneicosylresorcinol (11), with DoT-factors of 53 and 96 for bitterness and 111 and 193 for astringency, were revealed to be particularly potent off-taste compounds. Fatty acids palmitic acid (1), oleic acid (3), linoleic acid (4), linolenic acid (5) and fatty acid oxidation products E-9,10-13-trihydroxyoctadec-11-enoic acid (6) with DoT-factors ranging between 3.8 and 11.7 were also shown to be clear contributors to bitterness and astringency in wheat bran fibres. Compounds 2, 7 and 8 were determined to have DoT-factors < 1, showing likely to have only cumulative contributing effects to the off-taste of wheat bran fibres (Table 3).
3.6. Quantitation of off-taste-compounds in commercially available wheat bran
As a comparative study, commercially available wheat bran was analysed for the identified compounds. The wheat bran products were extracted, and the compounds quantified as reported above. The DoT-factors are portrayed in a heatmap in accordance with the contribution of the respective compounds in Figure 5. Similarly to the studied wheat bran fibres, fatty acids as well as alkylresorcinols are shown to be major contributors to off-taste in commercially available wheat bran isolates. Only manufacturer ‘Schneekoppe’ was shown to have smaller concentrations of fatty acids, amounting to comparatively low DoT-factors of this compound group.
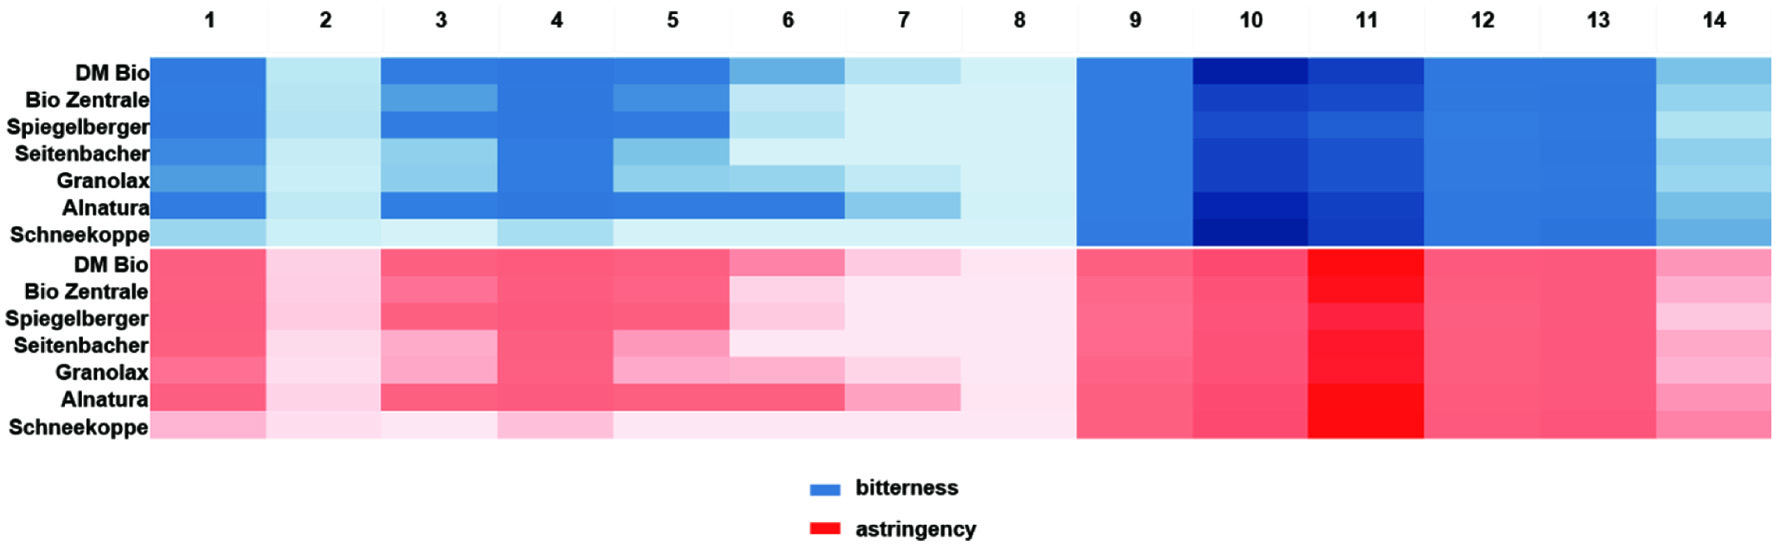 Click for large image | Figure 5. Heatmap of identified off-taste compounds in commercially available wheat bran showing DoT-factors. |
Therefore, by means of activity-guided fractionation alkylresorcinols, fatty acids and fatty acid oxidation products were determined to contribute to off-taste in wheat bran fibre isolates, being in agreement with literature (Andersen et al., 2011; Dawid et al., 2012; Scharbert and Hofmann, 2005; Sharanappa et al., 2016). Moreover, alk(en)yl resorcinols were, to our knowledge, for the first time demonstrated to impact the perceived bitterness and astringency of wheat bran isolates, previously only having been described as having a germ-like flavour (Heiniö et al., 2008).
| 4. Conclusion | ▴Top |
This study indicated that the SENSOMICS approach was successfully applied to identify the key off-taste compounds in wheat bran. Wheat bran consumption e.g. the incorporation of wheat bran in food products, as for all whole grains, has been widely recognized as beneficial to health, but hampered by the bitter off-taste. With the knowledge of the molecular reasons for this bitter off-taste, wheat bran producers have now the chance to optimize their products regarding extraction and processing, yielding lower or no amounts of the bitter off-taste compounds in their products in the future.
The preparation of this paper was supported by the enable Cluster funded by a grant of the German Ministry for Education and Research (BMBF, 01EA1409A).
Conflict of interest
The authors declare no competing financial interest.
| References | ▴Top |