| Journal of Food Bioactives, ISSN 2637-8752 print, 2637-8779 online |
| Journal website www.isnff-jfb.com |
Original Research
Volume 20, December 2022, pages 17-28
Flavor compounds, free amino acids, and proteins in Agaricus bisporus mushroom powder
Mindy Davilaa, Jyotishree Routraya, John Beattyb, Xiaofen Dua, *
aDepartment of Nutrition and Food Sciences, Texas Woman’s University, 304 Administration Dr., Denton, TX 76204, USA
bDepartment of Chemistry and Biochemistry, Texas Woman’s University, 304 Administration Dr., Denton, TX 76204, USA
*Corresponding author: Xiaofen Du, Department of Nutrition and Food Sciences, Texas Woman’s University, 304 Administration Dr., Denton, TX 76204, USA. Tel: +1-940-898-2667; E-mail: xdu@twu.edu
DOI: 10.31665/JFB.2022.18325
Received: September 23, 2022
Revised received & accepted: November 15, 2022
| Abstract | ▴Top |
Mushrooms contain a remarkable amount of complete protein, indicating potential as a conventional protein alternative. Commercially available mushroom powder would be protein concentrate and isolate starting material, while valorizing all powder molecules is sustainable and economical. This study aimed to quantify taste-related compounds (five soluble sugars, five organic acids, and five 5′-nucleotides), 23 free amino acids, protein, and other proximate compositions in two A. bisporus mushroom powders. The most dominant sugar was mannitol (5.6 and 6.9% dry matter), followed by glucose and sucrose. The major acid was oxalic acid (0.30 and 0.48%), followed by acetic and malic. Among five nucleotides, 5′-GMP (umami taste, 0.08 and 0.11%) was predominant. Total free amino acids were 4.0 and 6.5%, of which Glu (umami taste, 1.1 and 1.4%) was dominant. Asp (umami taste, 0.27 and 0.67%) was lower. The mushroom powders contained all essential and sweet- and bitter-related amino acids along with around 20% protein; the protein included at least six different fractions per SDS-PAGE. The powders were also majorly comprised of carbohydrates, especially fiber. These results demonstrated taste-related compounds and the nutritional composition in mushroom powders, providing evidence for mushroom powder use as a starting material to develop mushroom protein concentrates and isolates.
Keywords: Mushroom sugar; Mushroom acids; 5′-nucleotide; Mushroom protein; Mushroom carbohydrate; Plant-based protein
| 1. Introduction | ▴Top |
The global demand for meat substitutes continues to climb due to a growing need for an increasing proportion of plant-based foods in diets. Plant applications, namely soy protein, currently dominate the animal protein substitute knowledge base. The most potent sources of plant-based protein are seeds like beans, grains, and nuts (Loveday, 2020). The smaller industry protein isolate players include canola, rice, and potato (Gorissen et al., 2018). Non-plant meat analog applications include algae, whole mushroom (fruiting body of mycelium), and whole mycelium (root-like in appearance, the true vegetative portion of mushroom).
Indeed, mushroom as a whole (fresh or dried powder) has been explored to partially or completely substitute meat in several studies (Joshi and Kumar, 2015; Kumar et al., 2017; Spencer and Guinard, 2018; Stephan et al., 2018; Wong et al., 2017; Wong et al., 2019). Examples of mushroom substituting meat-based products include beef patties, meat-based mixed dishes, and pork and chicken sausage (Akesowan, 2016; Guinard et al., 2016; Spencer and Guinard, 2018; Stephan et al., 2018; Tom et al., 2018; Wong et al., 2017; Wong et al., 2019). Mushroom powder has been used in bakery products such as bread, cakes, and biscuits (Salehi, 2019). In addition, mushroom has the potential to be used as a replacer of fat, salt, nitrite, and phosphate (Rangel-Vargas et al., 2021). It is noteworthy that mushroom fruiting body protein isolation intended for meat analog use does not appear to have been attempted in literature to date.
Using the whole mushroom (either fruiting body or mycelium) has advantages of the simple process such as making dried powder/flour; however, the whole mushroom flour has limited use due to its undesired flavor, massive fiber content, and undesired food functions in the end products. Therefore, fractionation into different ingredients is a potential approach to increase mushroom use and value-added in the food chain. In addition, to be successful in the market, the cost-effectiveness of ingredients and the feasibility of industrialization are the two major aspects that should be considered. One such example is the citrus industry. Almost all citrus fruits’ portions (juice, pulp, peel, seeds) are developed to create competitive and cost-effective ingredients for industry use.
Using mushrooms as plant-based protein has certain advantages. First, protein content in mushrooms is 20–40% dry weight, which is a higher quantity and quality compared to other vegetable proteins (Bauer Petrovska, 2001; Friedman, 1996). The high-quality source of mushroom protein has the potential to emerge as the preferred choice for plant-based protein, although such products as concentrates or isolates are not commercialized yet. Second, raw mushroom primarily consists of water, carbohydrates (chitin, glucan), protein, amino acids, nucleotides, sugar, vitamins, and volatile compounds. These compositions contribute to nutrients, flavor (aroma and taste), and texture. Therefore, these compositions have the potential to be separated and developed as industrially valuable ingredients. Third, indoor mushroom cultivation could have up to 10 cycles per year and does not rely on the weather, which makes it a sustainable source of raw materials. Therefore, the mushroom can be considered a sustainable source of protein, nutrients, and flavor compounds.
Although several studies have attempted to isolate mushroom protein (Bauer Petrovska, 2001; Cruz-Solorio et al., 2018; González et al., 2021; Kimatu et al., 2017; Zou et al., 2021), the characterization of mushroom fruiting body crude protein are only noted in two studies (Bauer Petrovska, 2001; Kimatu et al., 2017). There is a knowledge gap for mushroom protein extraction approaches and characterizing its compositional and functional properties. Dried powder (whole fruit) is the starting material to make protein concentrates or isolates; however, the literature focuses on applying mushroom powder in food products (Salehi, 2019), instead of evaluating the contribution of the chemical composition. In addition to nutritional properties for plant-based protein, other factors determining the successful commercialization of plant-based protein would be food function performance and the presence of bland flavor (no off-flavor). Although mushroom protein food functions are unexplored, characterization commonly requires emulsifying, gelling, and water and fat binding abilities.
This study aimed to investigate non-volatile taste-related small molecules (sugars, organic acids, and 5′-nucleotides), free amino acids (taste and nutrients), protein and its fractions, and other compositions in two commercially available A. bisporus mushroom powders, with a comparison to soy protein isolate and mycelium. A. bisporus is the most common edible fungi in the US, accounting for 98% of the market share (Robinson et al., 2019), which was selected for the current assay. Mycelium (whole powder), also commercially available, claims to be a plant-based protein substitute. Soy protein isolate is the current most dominant plant-based protein in the market, which was selected to serve as a benchmark for mushroom protein. Comparing mushroom powder results to a well-established plant-based protein (soy protein) would assist in clarifying the value of mushroom chemical composition as food ingredients. The outcome of the current study’s mushroom powder compositional characterization would direct the next step for mushroom protein isolation and other industrially valuable compound isolation and potential application.
| 2. Materials and methods | ▴Top |
2.1. Mushroom samples
Two mushroom powders, both from A. bisporus, were used in this study. Manufacturers of the powders were Van Drunen Farms (Momence, IL, USA) and Phillips Farms (Kennett Square, PA, USA), labeled as powder 1 and powder 2, respectively. The Van Drunen Farms powder was spray dried at 60–82.2 °C for 18–24 hr, while the Phillips Farms mushroom powder was air dried, according to information provided by the manufacturer. One mycelium powder was purchased from Amazon and produced by Fungi Perfect (Olympia, WA, USA); it used organic whole grain brown rice as a substrate to create a final product containing a minimum of 55% polysaccharides (information provided by the manufacturer). A soy protein isolate (Now Foods, Bloomingdale, IL, USA) was purchased from Amazon and treated as a control in this study.
2.2. Soluble sugar quantification using HPLC-UV
Soluble sugar quantification with HPLC used the same approach as shown in our previous publication (Du et al., 2021). About 1 g of powdered sample was dissolved in 60 mL Milli-Q water, which was sonicated for 10 min. The dissolved mixture was centrifuged for 15 min at 4,000 rpm (1,431 ×g). This extraction procedure was repeated once. The pooled supernatants (about 100 mL) were evaporated to dryness at 40 °C in a rotary evaporator. The residue (triplicate preparation) was then reconstituted with 5 mL Milli-Q water. A 0.22-µm nylon filter (Fisher Scientific, Rockwood, TN) was used to filter the reconstituted solutions before HPLC injection.
Sugar analysis of the samples was performed using an HPLC-UV system (Shimadzu USA Manufacturing, OR, USA) configured with a RestekTM Ultra Amino column (5 µm particle size, 250 × 4.6 mm column diameter). The HPLC system has a binary pump (LC-20AR), degassing unit (DGU-20A 3R), autosampler (SIL-20A), and UV detector (SPD-20A). Injection volume was set to 30 µL with a flow rate of 2.0 mL/min. The analysis was performed with an isocratic mobile phase consisting of water and acetonitrile in a 25:75 v/v ratio run at 190 nm UV detection.
Sugar quantification was done using analytical standard grade glucose, fructose, sucrose, mannitol, and ribose obtained from MilliporeSigma (Milwaukee, WI, USA). The solutions for all six sugar standards were used to construct the calibration curves in seven known concentrations (0.5–60.000 mg/g) in triplicate. The standard calibration curves (r2 > 0.998) were used to identify and quantify the sugars present in the samples by comparing their retention times and peak areas.
2.3. Organic acid quantification using HPLC-UV
Organic acid quantification with HPLC used the same approach as shown in our previous publication (Du et al., 2021). The same extraction procedure was followed to prepare the supernatants. The following further dilution was done for two mushroom powders to fit the samples in the developed calibration curves: 5 mL of original supernatant was combined with 20 mL of Milli-Q water. Mycelium and soy protein samples were prepared with 5 mL of the original supernatant. All samples (triplicate preparation) were filtered with a 0.22-µm nylon syringe before injecting into the HPLC.
Organic acid analysis of the samples was performed using an HPLC-UV system configured with a Restek TM Ultra AQ C18 column (5 µm particle size, 250 × 4.6 mm column diameter). The analysis was performed with an isocratic mobile phase composed of methanol and water in 5:95, v/v ratio run at 214 nm UV detection. The aqueous phase was comprised of 0.01 M monopotassium phosphate (KH2PO4) adjusted to 2.79 pH using phosphoric acid. The sample was injected at 80 µL with a mobile phase flow rate of 1.0 mL/min.
Organic acids were quantified using analytical grade standards obtained from MilliporeSigma. Triplicate solution preparations for all five organic acid standards were used to construct the 7-point calibration curves for oxalic acid (0.0015–0.5405 mg/mL), citric acid (0.002–0.2824 mg/mL), malic acid (0.009–0.259 mg/mL), acetic acid (0.0064–0.2823 mg/mL), and fumaric acid (0.0016–0.176 mg/mL). The standard calibration curves (r2 > 0.999) were used to identify and quantify the organic acids present in the samples by comparing their retention times and peak areas.
2.4. 5′-Nucleotides quantification using HPLC-UV
5′-Nucleotide quantification with HPLC used the same approach as shown in our previous publication (Du et al., 2021). The samples were first blended and boiled for 1 min with Milli-Q water. The solution was centrifuged at 4,000 rpm (1,431 ×g) for 30 min and filtered. For the two mushroom powders, 5 mL supernatant was further diluted by adding 20 mL of Milli-Q water, while 5 mL of original supernatant was used for mycelium and soy protein. All samples were prepared in triplicate and passed through a 0.22-µm nylon syringe filter prior to HPLC injection.
5′-Nucleotide analysis of the samples was performed using an HPLC-UV system configured with a RestekTM Ultra AQ C18 column. The isocratic analysis was performed with mobile phase A, composed of 0.05% orthophosphoric acid (stock purity: 85%) in water, and mobile phase B, pure methanol, in a 5:95 (v/v) ratio run at 259 nm UV detection. The sample injection volume was 80 µL with a mobile phase flow rate of 1.0 mL/min.
5′-Nucleotides were quantified using analytical standard grade inosine 5′-monophosphate disodium salt (5′-IMP), guanosine 5′-monophosphate disodium salt (5′-GMP), adenosine 5′-monophosphate sodium salt (5′-AMP), cytidine 5′-monophosphate disodium salt (5′-CMP), and uridine 5′-monophosphate disodium salt (5′-UMP) obtained from MilliporeSigma. The triplicate solution preparations for all five nucleotide standards were used to construct the 7-point calibration curves for 5′-IMP (0.0016–0.0836 mg/mL), 5′-GMP (0.0017–0.0833 mg/mL), 5′-AMP (0.0017–0.0834 mg/mL), 5′-CMP (0.0018–0.0864 mg/mL), and 5′-UMP (0.0017–0.0833mg/mL). The standard calibration curves (r2 > 0.999) were used to identify and quantify 5′-nucleotides present in the samples by comparing their retention times and peak areas.
2.5. Thermally unstable arginine quantification with HPLC-UV
Free Arg, a thermally labile amino acid, was quantified using HPLC-UV. A similar procedure has been published previously (Du et al., 2021). In brief, 4 g of powdered sample was mixed with 40 mL of DI (de-ionized) water and then centrifuged at 4,000 rpm (1,431 ×g) for 10 min. To precipitate large proteins and carbohydrates out of the sample solution, the supernatant was combined with acetonitrile in a 3:5 ratio (supernatant: acetonitrile) (Martens-Lobenhoffer and Bode-Böger, 2003). After remaining stationary overnight at 4 °C, the supernatant and acetonitrile mixture was centrifuged (3,000 g, 5 min) and rotary evaporated (60 °C, 20 min) (Ridwan et al., 2018). Five mL DI water was added to the dry rotary evaporator flask. The sample was readied for injection by passing through a 0.22-µm nylon syringe filter.
The HPLC-UV system was installed with a C18 column. Upon sample injection (20 μL), the flow rate was at 0.5 mL/min, mobile phase A (0.1 % orthophosphoric acid [stock-85% purity] in water, v/v) was at 100%, and mobile phase B (pure acetonitrile) was at 0%. Mobile phase B was programmed to rise steeply to 95% by 15 min. Although the total analysis time was 40 min, 30 min of that time was used for cleaning (retention time 10–15 min: increase the flow rate to 1.5 mL/min, retention time 15–20: hold for 5 min) and reversion to starting mobile phase composition and flow rate (retention time 20–25 min: mobile phase B to 0%, flow rate to 0.5 mL/min) with a stable baseline (retention time 25–40 min: hold for 15 min). The UV detector was set at 200 nm.
Arg was analytical grade and obtained from MilliporeSigma. In like fashion, 7 Arg standard solutions (0.48, 0.32, 0.16, 0.08, 0.04, 0.02, and 0.01 mg/mL DI water) were analyzed in triplicate using the same HPLC test parameters. The subsequent peak area-derived calibration curve was linear (r2 = 0.985) and forced through the origin. Sample peak areas were translated to arginine concentration using the calibration curve.
2.6. Free amino acid quantification using GC-MS
Aside from Arg, all other free amino acids were derivatized and quantified using GC-MS, as shown in our previous publication (Du et al., 2021). The EZ:faastTM Free (Physiological) Amino Acid Analysis by GC-MS kit (catalog number KG0-7166) was purchased from Phenomenex (Torrance, CA, USA). The amino acid analysis kit was accompanied with amino acid standards SD1 (mixture of 22 amino acids) and SD2 (mixture of 3 amino acids).
Briefly, 4 g of each powdered sample was blended with 40 mL of DI water, and the mixture was centrifuged to obtain a supernatant. The 100 µL aliquot of prepared supernatant was derivatized with the analytical kit. Because some analytes were more concentrated, derivatization was also performed using 100 µL of diluted supernatant (a mixture of 1 mL original supernatant and 4 mL DI water).
For quantification, linear (r2 0.99, excluding Glu r2 = 0.97, Cys r2 = 0.95, and Ser r2 = 0.94) single ion mass chromatogram calibration curves were constructed using 7–11 concentration levels (12.6–3,200 nmol/mL) of the kit’s SD1 and SD2 standards. Aside from Thr, Ser, and Cys, all curves were forced to intersect with the origin. The derivatization and analysis procedures for the standards were identical to that applied to the samples. The kit’s SD1 and SD2 standard mixtures were analyzed the same way to confirm identifications. Compounds were identified by comparing their ion spectra and retention time to the kit’s published values. In total, 25 free amino acids were analyzed, however, only 22 were detected in this study’s samples.
2.7. Protein extraction from mushroom powder
Protein extraction was completed solely using the Phillips Farms mushroom powder (powder 2). The extraction scheme is shown in Figure 1. To extract the protein, 3.35 g of mushroom powder was combined with 50 mL of preheated alkaline water, which was continuously stirred at a speed just prior to vortex formation. It took 5 min ± 40 sec to homogenize the mushroom powder and adjust the pH back to either 10 or 12 using 1 M hydrochloric acid or 50% (w/v) sodium hydroxide. Afterwards, the sample was either stirred ambiently for 20 min or stirred in a 50 °C water bath (DWK Life Sciences Kimble, Hanover Park, IL, USA) for 20 min. The mixture was then centrifuged (1,431 ×g, 10 min, 10 °C). To separate the supernatant from the pellet, the centrifuged sample was allowed to drain into a separate container at a 45 ° angle for 5 min. In the end, four supernatant and four pellet samples were generated which varied in applied extraction pH (10 and 12) and temperature (ambient and 50 °C). All eight samples were dried in a vacuum oven (70 °C, 25 in Hg); supernatant pH’s were adjusted to pH 7 prior to drying. Some analyses not affected by possible denaturization were completed using forced draft oven-dried samples (90 °C) with no post-extraction pH adjustment; notations have been made where this applies.
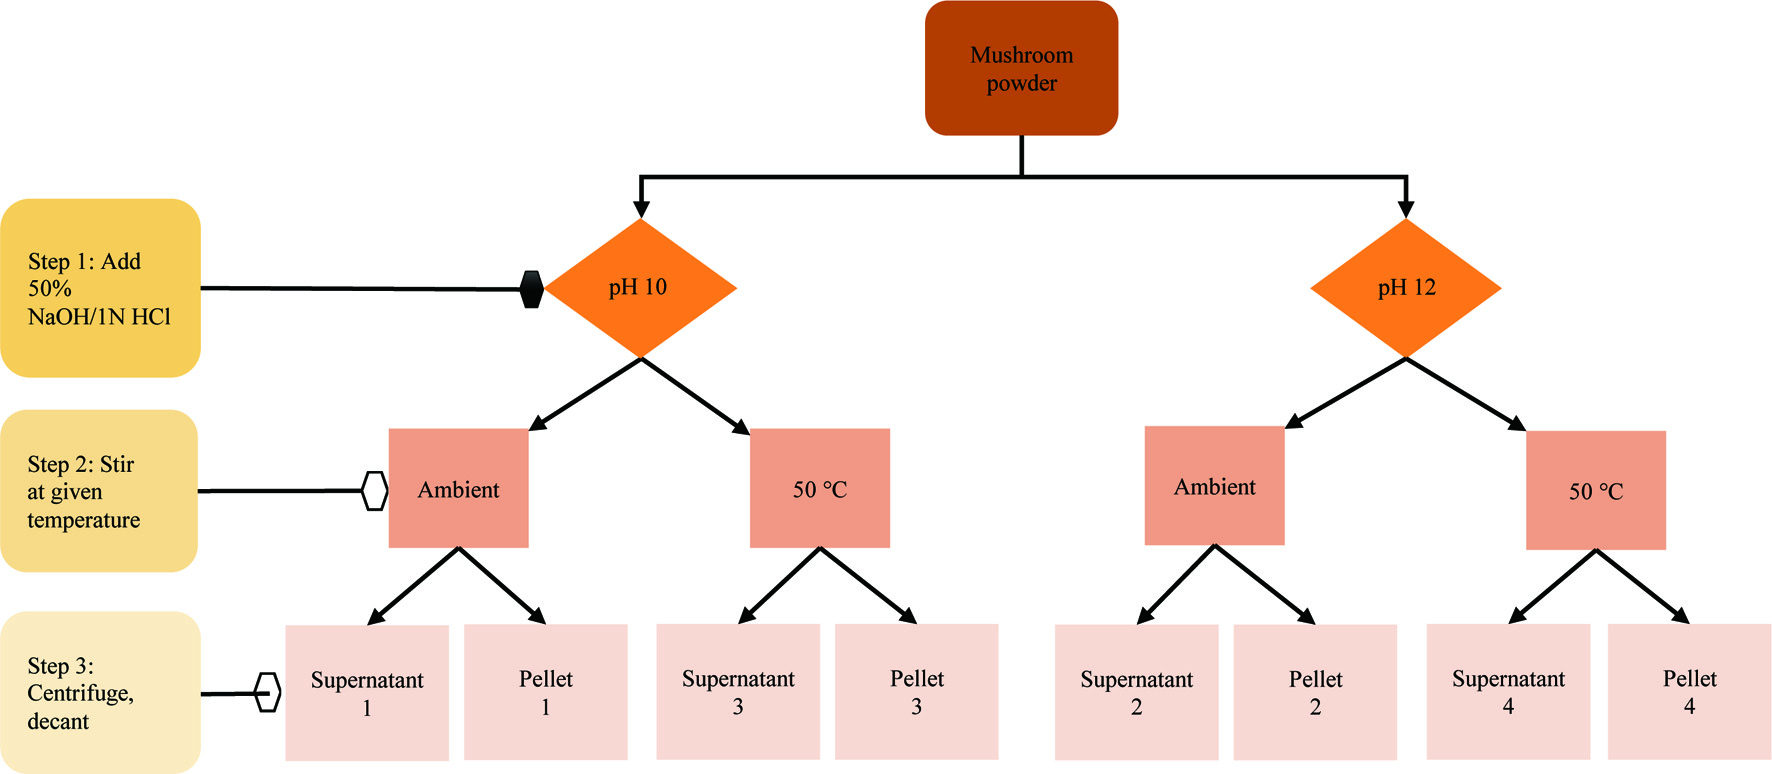 Click for large image | Figure 1. Mushroom powder protein isolation scheme. All extractions were 20 min. 50% NaOH and 1 N HCl were used as needed to adjust extraction pH back to setpoint immediately after mushroom powder addition. |
2.8. Moisture, protein, ash, and fiber content
The moisture content of the four powdered samples (soy protein isolate, mycelium, powder 2, and powder 1) was determined gravimetrically using a forced draft oven (Stabil-Therm gravity oven, Blue Island, IL, USA) set to 100 °C. At least 0.9 g of each sample was heated in the oven using a partially covered aluminum dish for 3 hr; after, weights were checked in 30 min intervals until weight loss was no greater than 0.002 g between intervals. Samples were allowed to cool in a desiccator for 30 min before weights were recorded.
Protein analysis for the four powdered samples was completed via the Kjeldahl method. To begin the Kjeldahl, 0.5 g of each powdered sample was wrapped in one small sheet of glassine weigh paper and combined with 10 mL sulfuric acid and one FisherTab ST-AUTO Kjeldahl tablet (potassium sulfate and selenium to speed digestion); this mixture was digested using setting four on the Labconco digestion block for 10 min, followed by the 7.5 heat setting for 3 hr. The clear, cooled digest was distilled for 10 min using the Labconco RapidStill II (Kansas City, MO, USA) with 25 mL of the receiving solution: 4% boric acid (pre-adjusted to 4.65 pH using 0.1 N sodium hydroxide) and four drops of bromocresol green-methyl red indicator; 30 mL 50% sodium hydroxide was pumped into the digest immediately before distillation. The volume of 0.1 N standardized hydrochloric acid required to titrate the receiving solutions back to a pH of 4.65 was used to calculate the estimated protein content. The same method was used to estimate protein content in the eight forced draft oven-dried (90 °C) supernatants and pellets. The conversion factor used was 6.25 for soy protein and 4.38 for all mushroom samples.
To measure ash content, the four powdered samples were placed in a muffle furnace (Thermolyne; Thermo Fisher Scientific, Hanover Park, IL, USA) set to 525 °C for 12 hr. The temperature increased at 190 °C per hour until the setpoint of 525 °C was reached. After the furnace cooled to 100–110 °C, samples were relocated to a desiccator and cooled at least 30 min before weighing. The same method was used to estimate ash content in the eight forced draft oven-dried (90 °C) supernatants and pellets.
Fiber determination was performed using a commercially purchased Total Dietary Fiber kit (Sigma, Milwaukee, WI, USA). Fiber analysis was completed in quadruplicate per the kit’s instructions, which involved duplicate ash and duplicate protein adjustment of the quantified fiber residue. The ash and protein procedures were detailed in this section of the manuscript. The same method was used to estimate fiber content in the eight forced draft oven-dried (90 °C) supernatants and pellets.
2.9. Protein yield and mass balance calculation
To elucidate mass balance changes resulting from extraction conditions, dry supernatant and pellet weights in addition to the original mushroom powder weight were compared to one another. Before drying in a forced draft oven (90 °C), total wet supernatant and pellet weights were recorded (Wtotal, wet basis); to do so, the entire empty container weights were compared to filled container weights so that residual loss from container transfer would be eliminated. The act of transferring these products to the glass Petri dishes for drying created residual weight loss, especially for the wet pellet paste. Therefore, the drying process supplied only the moisture % to convert from wet basis (Wtotal, wet basis) to dry basis (Wtotal, dry basis); these dry basis values (Wtotal, dry basis) were effectively the total, or complete, masses of either the combined supernatant and pellet, supernatant alone, or the pellet alone. Wtotal, dry basis was also compared to the original mushroom powder weight to compute % mass yield (Wtotal, dry basis mass of interest–supernatant + pellet, only supernatant, or only pellet–divided by dry basis starting mushroom powder weight and then multiplied by 100).
The supernatant and pellet total masses (Wtotal, dry basis) were additionally converted to mass of protein using the % protein results from section 2.8. Protein % yield was computed by comparing the protein weight in the supernatant and pellet to that found in the starting mushroom powder sample (dry basis protein mass of interest–supernatant + pellet, supernatant alone, or pellet alone–divided by dry basis protein mass in starting mushroom powder and then multiplied by 100).
2.10. Total soluble solids and Bradford assay
Total soluble solids were measured as °Brix, with which 300 μL of each sample was analyzed using a handheld refractometer (Atago Co.k Ltd.k Tokyo, Japan). A 300 μL volume of DI water was used to tare the meter before and between samples. Although all samples were analyzed using 300 μL volumes, those volumes were drawn from a single prepared mixture for the supernatants and pellets due to limited sample availability.
The 12 samples tested were diluted with DI water to the same concentrations for °Brix and the Bradford assay: 18.4 % (w/w) for the four vacuum oven-dried supernatants and the four vacuum oven-dried pellets, 6.0 % (w/w) for mushroom powder 1 and 2, 2.0 % (w/w) for soy protein isolate, and 33.3 % (w/w) for mycelia. This was done by combining the solids and DI water, followed by centrifugation at 4,000 g (1,431 ×g), 10 °C for 10 min; the supernatant obtained was used to perform the necessary dilutions. To enhance band resolution, SDS-PAGE sample preparations were further diluted to 4.6 % (w/w) for both mushroom powders and 1.5 % (w/w) for soy; all other preparation concentrations remained the same, however, the pellets were not characterized via SDS-PAGE.
The Bradford assay was performed for each of the 12 samples to quantify soluble protein. To make 1 L of the Bradford reagent, 100 mg Coomassie Brilliant Blue G-250 was first solubilized in 50 mL 95% ethanol; 100 mL 85% phosphoric acid was then stirred in, and the volume was brought up to 1 L using a DI water and a volumetric flask. Before use, the reagent was filtered using Whatman 1 filter paper. A 10 μL sample was combined with 300 μL prepared Bradford reagent for analysis. After approximately 15 min, absorbance was recorded at 595 nm; the mean absorbance of a triplicate blank (10 μL DI water, 300 μL Bradford reagent) was subtracted from these absorbance readings before comparing their areas to the calibration curve to generate protein estimates in terms of mg bovine serum albumin (BSA) protein equivalents per mL. Although all samples were analyzed using triplicate 10 μL volumes, those volumes were drawn from a single prepared mixture for the supernatants and pellets due to limited sample availability.
A Bradford assay calibration curve was similarly prepared using the analytical method on 7 bovine serum albumin standard solutions ranging from 0.1–1.5 mg/mL. After subtracting the mean absorbances of a triplicate blank (10 μL DI water, 300 μL Bradford reagent) from those of the standard solutions, adjusted standard absorbances were plotted against BSA concentration to achieve an r2 of 0.992.
2.11. SDS-PAGE
SDS-PAGE (sodium dodecyl sulfate-polyacrylamide gel electrophoresis) was performed to characterize sample molecular weight. To prepare the samples for well loading, 52 μL of each sample was added to 1.5 mL microcentrifuge tubes and then vortexed for 5 sec with 20 μL of Bolt LDS Sample Buffer (4×) and 8 μL Bolt Reducing Agent (10×). The filled 1.5 mL tubes were placed in a 70 °C water bath for 10 min. A mini gel tank (Invitrogen PN A25977) was filled with 1x Bolt running buffer (until runoff began into the overflow chamber (∼400–500 mL). Each well in the precast Bolt 4 to 12%, Bis-Tris, 1.0 mm, mini protein gel was loaded with 15 μL of prepared sample. A 10 μL portion of SeeBlue Plus2 pre-stained protein standard, which ranges from 3 to 198 kDa, was directly loaded into an additional well; note that the standard required no sample preparation. The gel was run using a 90 W power supply (Invitrogen PN PS0090) for 22 min under a constant voltage of 200 V. All reagents and equipment used to run the gel were purchased from Thermo Fisher Scientific (Hanover Park, IL, USA).
To stain, the gel was placed into the following solution immediately upon removal from the cassette: 0.1% Coomassie Blue R250, 10% acetic acid, 50% methanol, and 40% water. After staining for 1 hr while shaking at 50 rpm, the gel was rinsed briefly with DI water and then de-stained overnight by soaking in the following solution with no agitation: 40 mL stain solution base (stain recipe minus Coomassie Blue R250) and 80 mL DI water. The DI water was added to the stain base to prevent gel shrinkage. A glass vial stuffed with 2 crumpled Kimwipes was also placed in the container to soak up the Coomassie Blue R250 as it is released into the solution. The following morning, the gel was transferred to fresh, 100% stain base and shaken at 50 rpm for 1 hr; this process was repeated using new stain base for another 30 min and then changing the stain base again for 1.5 more hr of agitation. The gel was placed into DI water for imaging and then 20% aqueous NaCl for long-term storage. This entire SDS-PAGE process was repeated multiple times with similar results, although minor process changes were made between gels for process optimization. The exact process details reported here are those used on the published gel image.
2.12. Statistical analysis
All analyses were conducted with statistical significance defined as α ≤ 0.05. One-way ANOVA (analysis of variance) was performed for sugars, organic acids, 5′-nucleotides, free amino acids, protein, and other proximate analyses. Post hoc pairwise comparisons with Tukey’s honestly significant difference (HSD) test were performed to identify the difference between samples. The SPSS v. 19.5 software (IBM SPSS Statistics, Armonk, NY, USA) was used to run these tests.
| 3. Results | ▴Top |
3.1. Sugars, acids, and nucleotides - taste enhancers
Three groups of taste-related compounds (sugars, acids, and nucleotides) were quantified in this study. The analyzed soluble sugars were glucose, fructose, sucrose, mannitol, and ribose (Table 1). Mannitol was the most dominant sugar in the two mushroom powders, which was 5.6 and 6.9% dry matter, respectively. The secondary dominant sugars were glucose and sucrose, accounting for 3.9–6.2% and 3.5–4.4% dry matter in the two mushroom powders. Ribose and fructose were the lowest, with contents less than 0.8%. In contrast, the soluble sugars in mycelium were significantly lower than in mushroom powders, except for fructose. Among the five quantified sugars, sucrose (1.0%) was most abundant in mycelium. Sucrose (2.5%) was similarly predominant in the soy protein isolate, but soy protein’s total sugar content was significantly lower compared to the mushroom powders.
 Click to view | Table 1. Content (mean ± SD, mg/g dry matter) of five soluble sugars, five organic acids, and five 5′-nucleotides in four samples |
Five organic acids were identified and quantified: malic, acetic, oxalic, fumaric, and citric (Table 1). Oxalic and acetic acids were the main ones found in the two mushroom powders, with content ranging from 0.34–0.48% and 0.28–0.35% dry matter for each acid. The secondary high content acids were malic and citric acids, with concentrations ranging from 0.15–0.19% and 0.11–0.19%, respectively. In contrast, mycelium and soy protein isolate had significantly lower contents of these five organic acids; the content was minimal and only 0.00–0.08% and 0.00–0.06%.
Five 5′-nucleotides (IMP, GMP, AMP, CMP, and UMP) were quantified (Table 1). GMP (umami enhancer) was the most dominant nucleotide, with a content of 0.08 and 0.11% in the two mushroom powders. CMP was also high in the mushroom powders, followed by IMP, AMP, and UMP. Both mycelium and soy protein isolate contrastingly had minimal 5′-nucleotide content––less than 0.004% in the mycelium and 0.02% in the soy protein isolate.
3.2. Free amino acids – nutrients and taste
A total of 23 free amino acids were quantified in four samples (Table 2). The mushroom powders included all nine essential amino acids, although there was a minimal amount of the essential amino acid Met. The mushroom powders contained 10 non-essential amino acids; only one non-essential amino acid (Cys) was not identified. In addition, four un-common amino acids (Aaa, Aba, Orn, and aIle) were identified. The total free amino acids in the two mushroom powders were 6.5 and 3.9% dry matter. In contrast, mycelium only had 0.05%, while soy protein isolate had 0.09% total free amino acids in dry matter.
Click to view | Table 2. Content (mean ± SD, mg/100g dry matter) of 23 free amino acids in four samples |
The major amino acids were Glu and Asp in the two mushroom powders, while Met, Aba, and aIle were least in quantity. Glu and Asp are the two significant umami taste contributors, and they were 1.4 and 1.1% for Glu and 0.27 and 0.67% for Asp in mushroom powder 2 and mushroom powder 1, respectively. Six sweet taste-related amino acids were Gln, Ala, Ser, Thr, Gln, and Pro. The mushroom powders contained a significant amount (>0.08% dry matter) of these sweet-related amino acids. It should be noted that Gln was the most dominant sweet-related amino acid in mushroom powder 1, with a content of 2.1%, while it was significantly lower in mushroom powder 2. Eight bitterness taste-related amino acids were Ile, Val, Leu, Arg, Phe, His, Met, and Tyr. The content of bitterness-related amino acids was lower than the sweetness-related amino acids in general. Three tasteless amino acids were Lys, Trp, and Asn. Their concentrations were low compared to the umami-, sweet-, and bitter-related amino acids. The four uncommon amino acids (Aaa, Aba, Orn, and aIle) had the lowest concentrations compared to the other groups. In mycelium and soy protein isolate, all individual free amino acids were low in concentration.
3.3. Other chemical compositions
In addition to the small, water-soluble molecules measured in this study, other chemical compositions such as moisture, protein, ash, and fiber were also quantified (Table 3). The major macronutrients in the two mushroom powders were carbohydrates (including fiber), which accounted for 37.6–43.3% of the total mass. Fiber accounted for 18.2–21.6% of the total mass, almost half of the carbohydrates, but the content was close to protein in the two mushroom powders. This is reflected in the total soluble solids (Table 4) and fiber content, which were around 65 and 20%, respectively. In contrast, soy protein isolate had a small amount of fiber, while mycelium had a high amount of estimated carbohydrates, accounting for 87.4%.
Click to view | Table 3. Content (mean ± SD, % dry matter) of the proximate moisture, protein, ash, and fiber, as well as estimated carbohydrate content in 12 samples |
Click to view | Table 4. Content (mean ± SD, %) of the soluble solids and soluble protein for 12 samples |
Protein was the second highest ranked proximate analyte in the two mushroom powders, accounting for 19.9 and 23.9% of the total mass. Soy protein isolate certainly had a significantly higher amount of protein (86.6%), which matched the manufacturer’s product information and indicates the purity of the product as well. However, protein content in mycelium was only 5.3%, much lower than in the mushroom powders.
3.4. Mushroom protein fraction composition and protein yield
The protein in the mushroom powders was separated using different extraction conditions, resulting in eight different fractions (Figure 1). The major chemical compositions for each fraction were analyzed, as shown in Table 3. Pellet fraction fiber contents of 42.2–46.8% demonstrate that the fiber largely transferred to the pellet fraction. The supernatants (protein fractions) only had a fiber content of 1.8–2.7%, although the supernatants were still dominated by carbohydrates (31.2–57.6%). The results indicated that the current approach could significantly remove fiber from the protein fraction. However, other carbohydrates were still the major mass in the mushroom protein fraction.
Protein yield was calculated to check the extraction efficiency (Figure 2). Around 60% of the protein was transferred to the supernatants, while about 40% was still in the pellets. The results indicated that some protein in the mushroom was not water-soluble, even with increased solution pH and extraction temperature. In addition, pH was the key factor determining the extract yield. As shown in this study, the pH 12 solution generated a higher yield compared to the solution with pH 10.
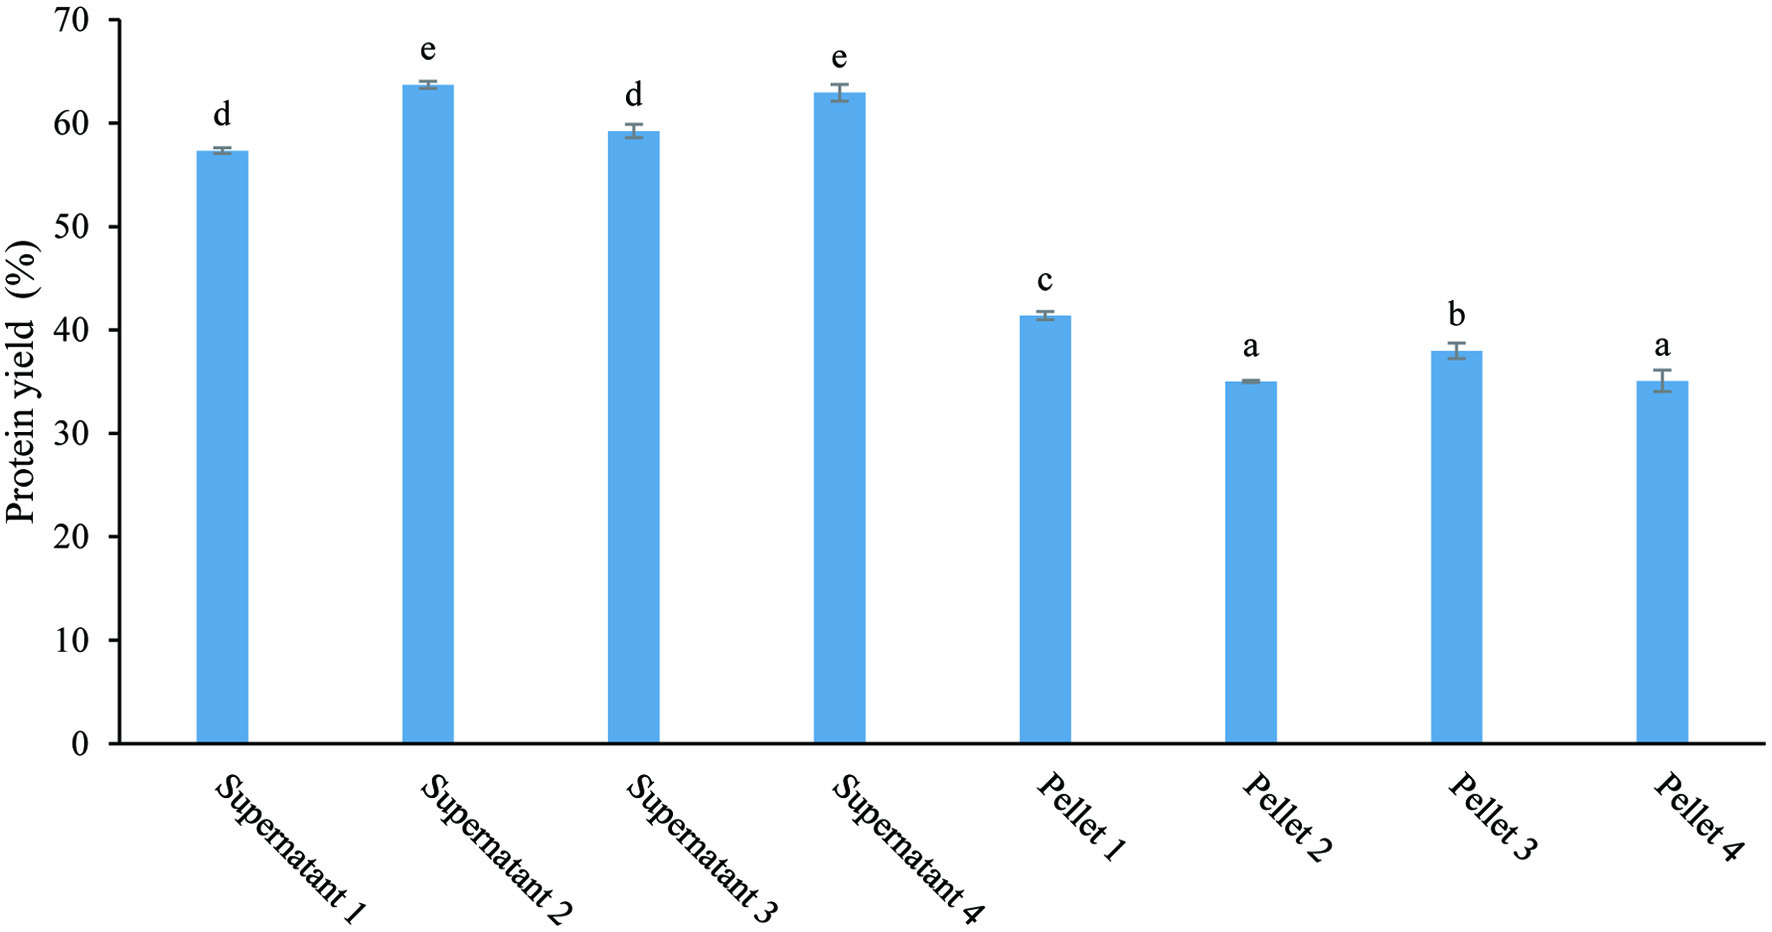 Click for large image | Figure 2. Protein yield for eight fractions from the mushroom powder (extraction scheme shown in Figure 1). |
3.5. Mushroom protein SDS-PAGE
To conduct SDS-PAGE for mushroom protein fractions and other samples, total soluble solids and soluble protein in the solutions were measured (Table 4). Supernatants had significantly higher amounts of total soluble solids compared to other samples. It should be noted that the supernatants were water-soluble fractions from mushroom powders with factors such as solution pH, salt, and temperature adjustment that induced chemical changes as compared to the original powder. Total soluble solid content was measured using the dried extracts re-dissolved in DI water and measured at room temperature.
Soluble protein in each sample was checked using the Bradford Assay to obtain a reasonable protein concentration for SDS-PAGE. Via multiple SDS-PAGE pretests, the optimal soluble protein content for each sample was determined, as shown in Table 4. The final protein concentration was 0.45–0.60% for the four supernatants. It was 3.6% for both mushroom powders, 0.1% for mycelium, and 5.6% for the soy isolate.
SDS-PAGE results for protein fractions and other samples were shown in Figure 3. Mushroom powders contained more than 10 bands, while the four supernatant fractions contained at least six bands. In addition, the supernatants mainly contained protein fractions with a molecular weight of less than 28 kDa, compared mushroom powder 2, which was evenly distributed up to 98 kDa. On the other hand, soy protein isolate had less diversity in protein composition, with two strong colored bands. It was hard to identify protein in the mycelium.
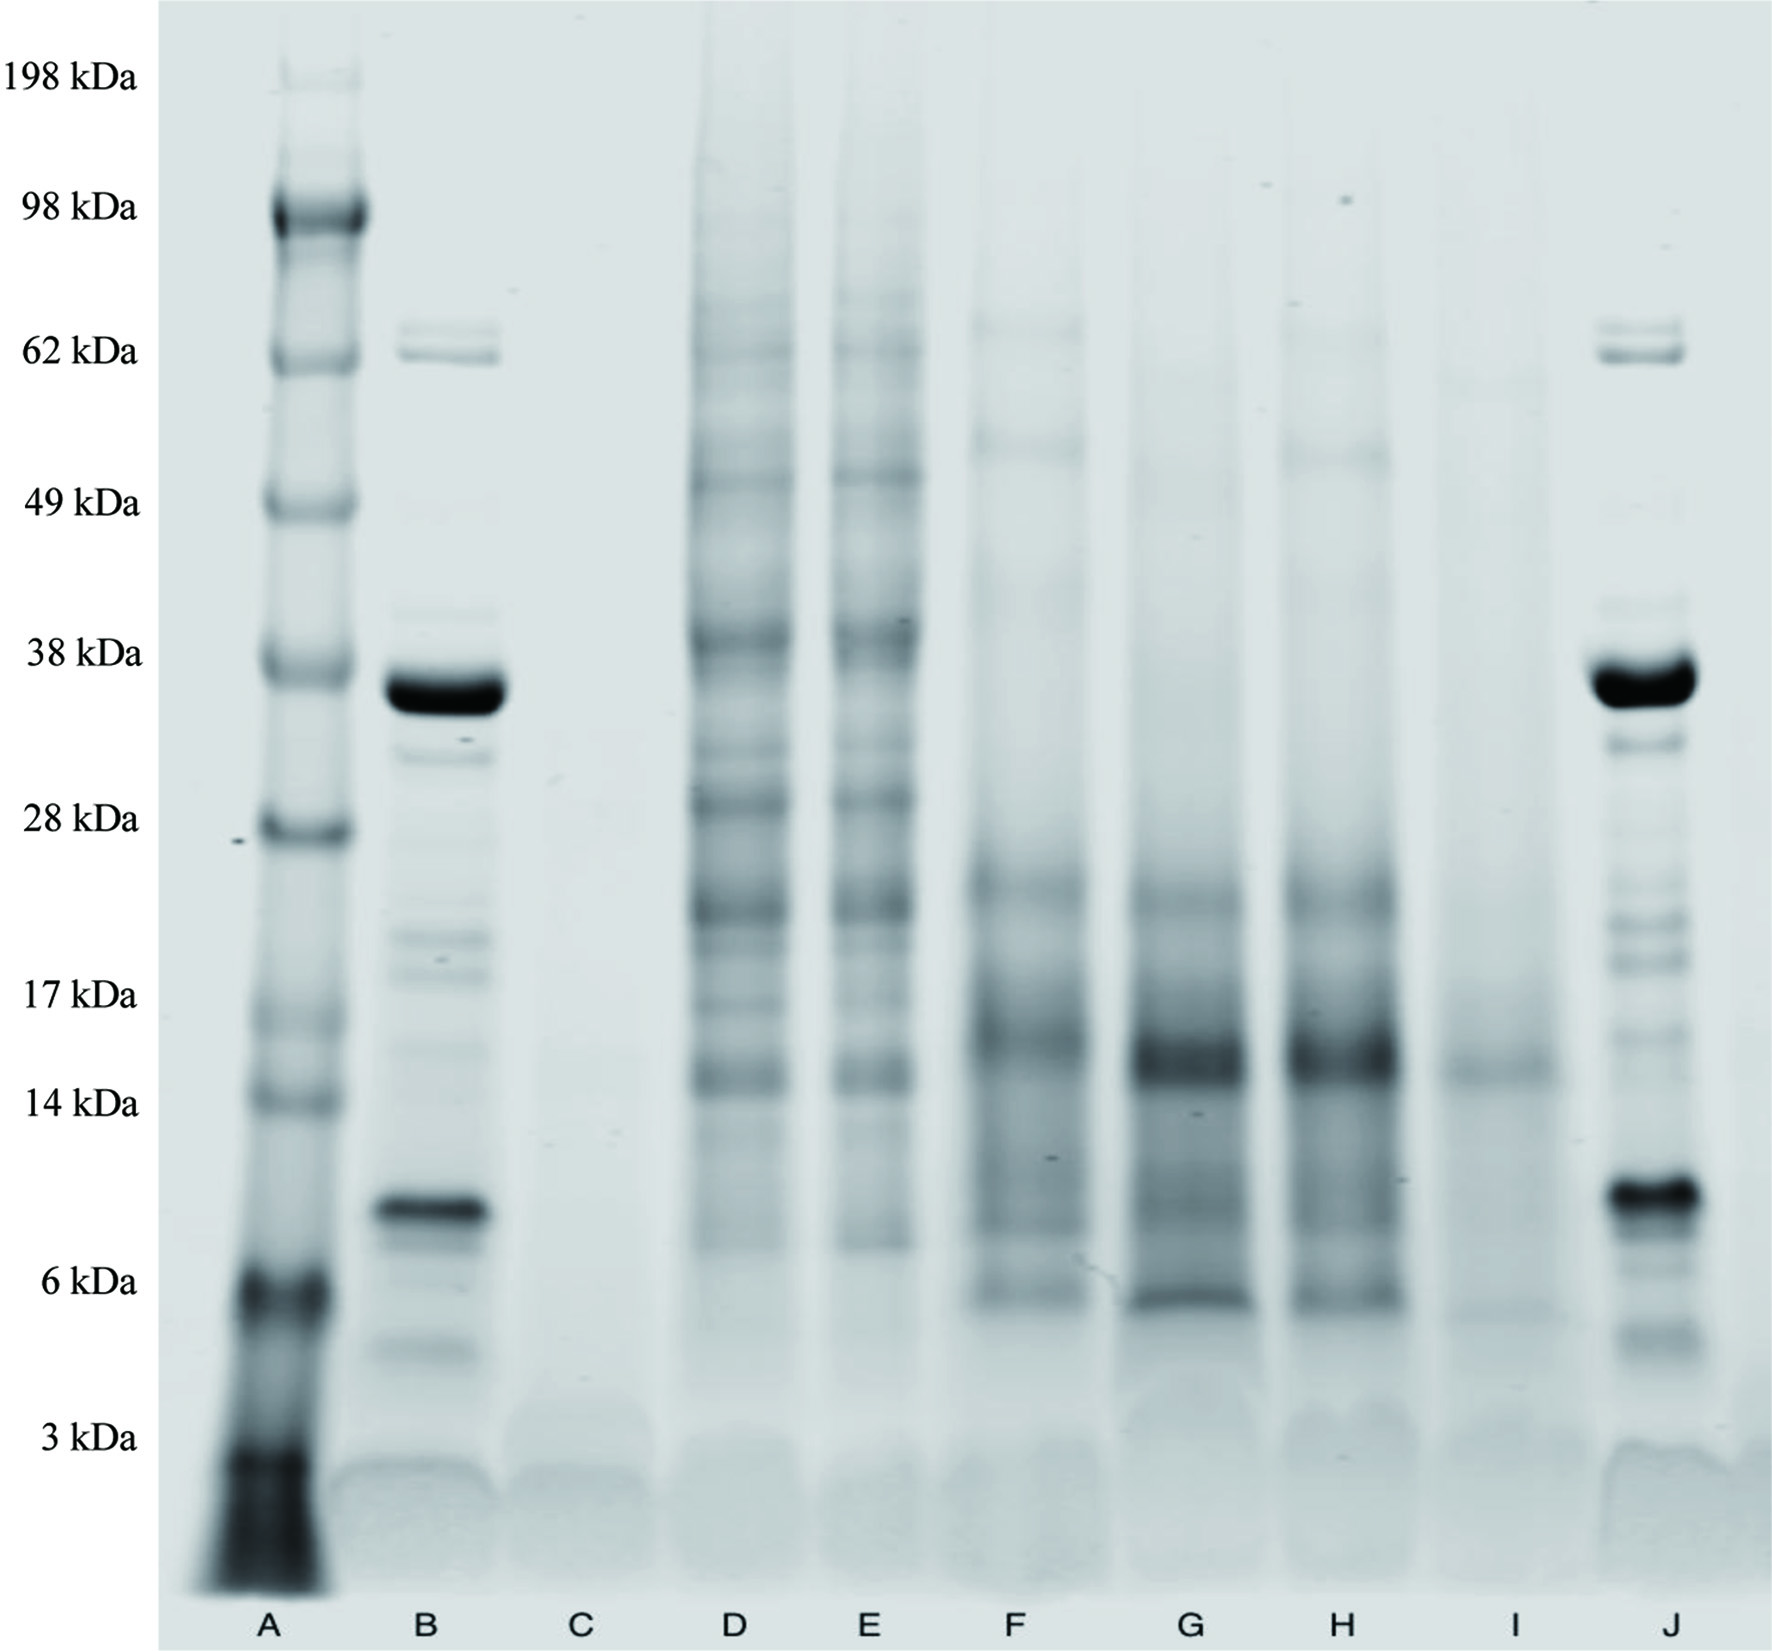 Click for large image | Figure 3. SDS-PAGE characterization of the following samples: A. Molecular weight standard (3–198 kDa); B. Soy protein isolate (1.5% solution, w/w); C. Mycelia (33.3% solution, w/w); D. Mushroom powder 2 (4.6% solution, w/w); E. Mushroom powder 1 (4.6% solution, w/w); F. Alkaline extraction supernatant 1 (18.4% solution, w/w)-pH 10, 20 min, ambient; G. Alkaline extraction supernatant 2 (18.4% solution, w/w)-pH 12, 20 min, ambient; H. Alkaline extraction supernatant 3 (18.4% solution, w/w)-pH 10, 20 min, 50 °C; I. Alkaline extraction supernatant 4 (18.4% solution, w/w)-pH 12, 20 min, 50 °C; and J. Soy protein isolate (1.5% solution, w/w). |
| 4. Discussion | ▴Top |
Ideally, the isolated protein should contain a minimum amount of other chemical compositions, which would broaden application possibilities in food products. Other chemical components in mushrooms should be upcycled to add value to the food chain. The other chemical compositions could be flavor-related (sugar, organic acid, nucleotide), bio-active (polyphenol, amino acid), or functional (carbohydrate). The flavor-related compounds should be removed to develop a widely usable mushroom protein ingredient. However, isolated flavor-related compounds have the potential to be used as flavorings; as ingredients, flavorings add extra value to the food chain as well.
Sugars, organic acids, and nucleotides are small and water-soluble molecules. Sugars and polyols are responsible for the sweet aspect of the fruiting body’s flavor profile, while organic acids can impart a sour taste (Kalac, 2013). Our previous sensory evaluation shows mushroom has weak sweet taste (Du et al., 2021). Sugars in mushrooms not only provide sweet taste but also play a role as flavor enhancers. For example, sugars can enhance saltiness and umami in addition to suppressing bitterness and sourness. The major sugar was mannitol (5.6 and 6.9%), followed by glucose in the two mushroom powders in this study. The results were consistent with literature in that mannitol is the predominant sugar in A. bisporus, while glucose is generally considered an important sugar for mushrooms as well (Kalač, 2009; Kalač, 2013; Wang et al., 2014). Glucose, ribose, arabinose, xylose, fructose, and lactose are commonly used in various meat-like flavorings in the food industry, indicating that the sugars in mushrooms have the potential to be used in savory flavor production.
Organic acids are commonly treated as acidity regulators in food systems. The role of organic acids in mushroom taste is unclear, although it has been mentioned that organic acids in edible mushrooms contribute to their complex and unique flavor (Hu et al., 2020). Among five organic acids quantified in this study, oxalic acid and acetic acid were the most dominant ones. Literature regarding organic acid content in A. bisporus is inconsistent. Highest amounts of succinic acid followed by citric, tartaric, malic, acetic, and fumaric acid are reported for fresh A. bisporus (Pei et al., 2014).
5′-Nucleotides are considered flavor enhancers, generally by enhancing existing umami flavor. Multiple umami-enhancing 5′-nucleotides such as IMP and GMP have also been identified in mushrooms by other researchers (Phan et al., 2018). 5′-IMP, 5′-GMP, and 5′-XMP (xanthosine monophosphate) are also called flavor 5′-nucleotides (Sun et al., 2020). 5′-IMP, 5′-GMP, and 5′-AMP are the three most impactful 5′-nucleotides for umami enhancement. The two A. bisporus mushroom powders in this study contain three flavor contributors (IMP, GMP, and AMP). The content of 5′-nucleotides in the two mushroom powders was lower than fresh A. bisporus mushroom (Davila et al., 2022), which is mostly likely caused by the thermal process for mushroom powders. Overall, the results show that mushroom powder is a good source of natural savory ingredients.
Free amino acids in the four samples were also quantified in this study. More than 20 amino acids have been identified in mushrooms (Sun et al., 2020), which contribute to both taste properties and nutritional value. The current study shows that A. bisporus mushrooms contained 23 free amino acids, including all nine essential amino acids. The results further verified the nutritional value of A. bisporus mushroom and were consistent with the literature reports of mushroom containing a favorable composition of amino acids. In fact, mushrooms are considered to have higher protein quality than most plants (Wang et al., 2014). In quantity, the two mushroom powders contained 4.0–6.5% total free amino acids on a dry basis. This amount was lower than what was found in our previous studies for fresh A. bisporus mushroom (Davila et al., 2022). Most likely, the drying process of mushroom powder caused the free amino acid loss since the thermal process commonly decreases the free amino acids (Sissons et al., 2022).
Besides the nutritional value, free amino acids could be sorted by their taste contribution, including umami, sweetness, bitterness, and no taste. Aspartic acid and glutamic acid are the two amino acids that contribute to umami taste – one of the most prominent features of mushrooms. High amounts of aspartic and glutamic acids in mushrooms have led to mushrooms being used as natural savory ingredients for both salt reduction and MSG replacer (Rangel-Vargas et al., 2021).
In addition to those flavor-related molecules in mushrooms, another major component is carbohydrates, which account for 50–65% of dry matter (Guo et al., 2022). Carbohydrates include polysaccharides such as dietary fiber (cellulose, hemicellulose, glucans, and chitin). The total dietary fiber forms a large portion of the mushroom carbohydrates and usually ranges from 4 to 55% dried matter (Villares et al., 2012). It has been reported that mushrooms usually contain 12.0–29.3% dried matter proteins (Wang et al., 2014). The protein content of mushrooms is not only dependent on species but also environmental factors and fruiting body maturity (Wang et al., 2014). Our current study shows the two A. bisporus mushroom powders contained around 20% protein in dry matter, with a conversion factor of 4.38 instead of 6.25, due to the high proportion of non-protein nitrogen compounds (Wang et al., 2014). The results suggest that A. bisporus mushroom contains a reasonable amount of protein and would be a good source for protein isolation.
By comparison, soy protein isolate contains a very small amount of these flavor-related compounds and is predominately protein. Mycelium also contains a small amount of these flavor-related molecules, and is mainly carbohydrates. The product’s purity might determine mycelium’s chemical composition since carbohydrates are the major precursor that sustains fungal growth (Jones et al., 2020). The current study’s chemical composition for the mycelium was very different from the literature report (Hashempour-Baltork et al., 2020).
Information on the extraction/isolation of mushroom protein in literature is scarce. Solution pH adjustment, such as using alkali extraction and isoelectric precipitation, are common techniques to separate protein from the remaining matrix (Cruz-Solorio et al., 2018; González et al., 2021; Zou et al., 2021). However, these studies did not record extraction yield data, although several studies investigated the food functions of the mushroom protein isolates (Cruz-Solorio et al., 2018; Zou et al., 2021). Few research studies have used non-conventional methods of pulsed-electric field extraction of mushroom protein (Xue and Farid, 2015). Results from our study demonstrated that alkali extraction effectively isolates mushroom protein from the matrix, but the mushroom protein was not 100% water-soluble. The finding was consistent with recent literature report (Zou et al., 2021).
Limited studies have focused on mushroom protein characterization, which has been shown to be a mixture of different protein fractions. One attempt involved a 6-way fractionation of protein in A. bisporus and 52 other mushroom varieties. Albumins (24.78%) were the dominate fraction, followed by globulins (11.46%), glutelin-like material (7.43%), glutelins (11.46%), prolamins (5.67%), and prolamin-like material (5.31%) (Bauer Petrovska, 2001). The other noted attempt included A. bisporus fruiting body protein isolation using an “ice-cold” 5% acetic acid and 2-mercaptoethanol (0.1%) extraction and overnight 75% ammonium sulfate isolation. The mushroom protein isolates and protein hydrolysates were characterized via SDS-PAGE, which showed multiple peptide fractions (Kimatu et al., 2017). Our current study shows that A. bisporus mushroom contains a diverse range of proteins with different molecular weights (Figure 3). A valuable next step would be further purifying the protein extract, fractionating these proteins, and characterizing their molecular weight and structure.
As a plant-based protein, nutritional quality is another aspect for consideration. Factors influencing protein quality include amino acid analysis method, digestion, food processing, anti-nutrients, and protein-energy relationship (Friedman, 1996). Although these analyses are out of the scope of the current study, mushroom has shown to serve as a source of good quality protein. The essential amino acid index calculated from the amino acid composition in mushrooms was above 85, showing that mushroom protein quality may approach that of animal protein (Friedman, 1996). The digestibility of mushroom crude protein is about 79% compared to 100% for an ideal protein (Friedman, 1996). In addition, digestible indispensable amino acid score (DIAAS) should be a valuable quality indicator for mushroom protein and could be included in the future study.
In addition to these compositions measured in A. bisporus in this study, other valuable compositions such as glucans, chitin, vitamin D, ergosterol, and phenolic compounds are out of the current study’s scope. It should be mentioned that mushrooms are also rich sources of these valuable compounds (Kalač, 2009; You et al., 2022). Because mushroom has a remarkable nutritional profile and significant amounts of industrially valuable compounds, it can be considered a good plant-based source for developing diverse natural ingredients for meat products. As aforementioned, limited studies have focused on mushroom protein isolation approaches and functional characterization, so this area would be a promising field to explore.
| 5. Conclusion | ▴Top |
This study investigated flavor-related compounds, free amino acids, and proximate composition in two A. bisporus mushroom powders, with a comparison of mycelium and soy protein isolate. It demonstrated that A. bisporus mushroom is a good source of protein as well as natural savory flavor compounds. Alkali extraction resulted in a protein yield of approximately 60%, which included at least six different molecular sizes. Investigation into mushroom protein isolation procedures and functional characterization will assist in unveiling the full industrial potential of mushrooms. The limitations of the current study are firstly only two mushroom powders were included in the present study, while different manufactural processing might bring in different chemical compositions for A. bisporus mushroom powder. Although much effort has been put into mushroom powder sourcing, overall, the powder is less available compared to other plant-based flours. Secondary, only limited manufacture information can be obtained regarding the purchased samples, although we have already tried very hard to communicate with the manufacturers, especially for mycelium. Third, only one soy protein product was included in this study, which might cause bias.
This research was supported by the Texas Woman’s University – Graduate Research Associate Award.
Conflict of interest
The authors declare no competing financial interests.
Mindy Davila conducted the quantification of free amino acids, proximate analysis, mushroom protein isolation and characterization, compiled and analyzed the data, and contributed to manuscript writing, revising, and finalizing. Jyotishree Routray conducted the quantification of sugars, organic acids, and 5′-nucleotides, compiled and analyzed the data, and contributed to manuscript writing. John Beatty supported GC-MS maintenance and guided the student for instrumental analysis. Xiaofen Du secured the funding source, designed the whole study, guided the research work and data process in each step, and drafted and finalized the manuscript.
| References | ▴Top |