| Journal of Food Bioactives, ISSN 2637-8752 print, 2637-8779 online |
| Journal website www.isnff-jfb.com |
Original Research
Volume 15, September 2021, pages 80-89
Optimized preparation of quassinoid-rich Eurycoma longifolia Jack phospholipid complex and its effects on oral bioavailability
Wu-Yan Guo#, Shu-Yan Wang#, Jian Ren#, Bo Zhang*
Tianjin Key Laboratory of Early Druggability Evaluation of Innovative Drugs, Tianjin International Joint Academy of Biomedicine, Tianjin, 300457, China
*Corresponding author: Bo Zhang, Tian Jin International Joint Academy of Biomedicine, No.220 Dongting Road, the Tianjin Economic-Technological Development Area (TEDA), Tianjin, China. Tel: +86 022 65378890; Fax: 86-22-65378036; E-mail: zhangbo@tjab.org
DOI: 10.31665/JFB.2021.15285
Received: June 24, 2021
Revised received & accepted: September 30, 2021
| Abstract | ▴Top |
Eurycoma longifolia Jack is a plant of the genus Eurycoma in Simaroubaceae. Eurycomanone is one of the main quassinoids of E. longifolia. Unfortunately, these quassinoids exhibit low bioavailability. In the present study, a phospholipid complex (TAF2-PC) was prepared to improve the oral bioavailability of TAF2 (Tongkat Ali Fraction 2). The complexation rate of eurycomanone and phospholipid was used as the index of success in the phospholipid complexes. The effects of reaction solvent, reaction temperature, drug concentration, drug-lipid ratio and reaction time on the complexation rate were investigated. Response Surface-Box-Behnken Design Method was performed to optimize the preparation technology and the pharmacokinetics of phospholipid complex of TAF2 were studied in rats. Our results showed that the optimum preparation condition of TAF2-phospholipid complex were as follows: reaction solvent, anhydrous ethanol; reaction time, 1h; the ratio of TAF2 to phospholipid, 2.28; reaction temperature, 40.85 °C; TAF2 concentration, 32.66 mg/ml; and complexation rate, 95.04 ± 0.4% (n=3). The results of pharmacokinetic study showed that the relative bioavailability was increased to 209.20% in the TAF2-phospholipid complex treated rats. Thus, this phospholipid-complex-technique shows potential for enhancing oral bioavailability of poorly absorbed quassinoid-rich E. longifolia extract, TAF2.
Keywords: Eurycoma longifolia; Quassinoids; Eurycomanone; Phospholipid complex; bioavailability
| 1. Introduction | ▴Top |
Eurycoma longifolia Jack (known as tongkat ali), one of the most popular traditional herbal medicine, is a flowering plant of the family Simaroubaceae, native to Indonesia, Malaysia, Vietnam and also Cambodia, Myanmar, Laos and Thailand. Decoctions of E. longifolia leaves are used for relieving itches, while its fruits are used to treat dysentery. Its bark is used mainly as an insect repellent, while the taproots are used to treat hypertension, and the root bark is used for the treatment of diarrhea and fever. The use of Eurycoma longifolia Jack as food dates back to the colonial period of 1,700 years ago. Indigenous people in Malaysia are used to taking tongkat ali decoction to treat intermittent fever, and Malay women also take tongkat ali decoction as a tonic after childbirth. Mostly, the roots extract of E. longifolia are used as indigenous medicine for sexual dysfunction, aging, malaria, cancer, diabetes, anxiety, pain, constipation, exercise recovery, fever, leukemia, osteoporosis, stress, syphilis and swollen glands, as well as an aphrodisiac, antibiotic, appetite stimulant and health supplement (Chan et al., 1989; Darise et al., 1983; Fiaschetti et al., 2011; Hussein et al., 2007; Katsunori et al., 2009; Kuo et al., 2004; Morré et al., 1998).
E.longifolia is a rich source of various classes of bioactive compounds, which includes quassinoids, β-carboline alkaloids, canthin-6-one alkaloids, squalene derivatives, biphenyl neolignan, and bioactive steroids (Ang et al., 2000; Katsunori et al., 2009; Kuo et al., 2004; Shah et al., 2012; Tran et al., 2014; Zakaria et al., 2009). A study by Lin et al. (2013) reported that over 50 quassinoids were present in E.longifolia. while eurycomanone 1 showed the most abundant content (Ling et al., 2013). As the main bioactive component of E.longifolia, the quassinoids have been reported to be pharmacological active against various diseases including malaria, anxiety, aging, osteoporosis treatment and improving sperm motility.
The bioavailability of the constituent eurycomanone was pharmacologically investigated in animal research. Low et al. demonstrated that following intravenous injection, eurycomanone was detected in the plasma, declining to zero within 8 h (Low et al., 2011). Following oral administration, Cmax and Tmax values were 0.33 ± 0.03 μg/mL and 4.40 ± 0.98 h, respectively. The plasma concentration was lower following oral administration versus intravenous administration, even at a much higher oral dose (five times the dose). It suggested that eurycomanone is poorly bioavailable (10.5%) when given orally. Following oral administration of Tongkat Ali Fraction 2 (TAF2), 13α(21)-epoxy-eurycomanone had a higher Cmax than eurycomanone (1.61 ± 0.41 μg/mL vs. 0.53 ± 0.10 μg/mL) (Chan et al., 2008; Leng et al., 2015; Low et al., 2011). The experimental results demonstrated that the absolute bioavailability was also higher due to increased membrane permeability. Moreover, eurycomanol and 13α,21-dihydroeurycomanone were not detected in plasma (Low et al., 2011). The distribution, excretion and half life of eurycomanone have been reported in many studies. In animal study, the volume of distribution (Vd) of eurycomanone was relatively high (0.68 ± 0.30 L/kg), suggesting that it is well distributed in the extravascular fluids (Low et al., 2005). Following intravenous injection, the mean elimination rate constant (ke) and clearance (CL) for eurycomanone were 0.88 ± 0.19 h−1 and 0.39 ± 0.08 L/h/kg, respectively and 13α(21)-epoxyeurycomanone had a longer biological half-life than eurycomanone (0.75 ± 0.25 h vs. 0.35 ± 0.04 h), due to the elimination rate constant (Low et al., 2005).
E.longifolia has a remarkable pharmacological activity. However, its poor oral absorption, fast metabolic rate and low oral bioavailability lead to its reduced efficacy. This drawback could be figured out by performing drug-phospholipid complex strategy, as they utilize mechanism which is similar to the absorption mechanism of nutritional constituents form gastro intestinal tract. The phospholipid complex enhanced the lipid solubility of hydrophilic plant components, enhancing their ability to cross phospholipid bilayer biofilms. The active components of herbal extracts from destruction by digestive enzymes and intestinal bacteria are protected by phospholipid complex (Jia et al., 2010).
A traditional Malaysian herb, E.longifolia, contains a large number of active ingredients. Most of these active substances have good water solubility and poor fat solubility, leading to a small amount of these active ingredients that can be effectively absorbed by the human body. Thus, in present study, we attempt to prepare novel quassinoids rich fractions (Tongkat Ali Fraction 2, TAF2) – phospholipid complex using the solvent evaporation method to improve the liposolubility of active substance of E.longifolia and thereby to promote its oral bioavailability. The effects of reaction solvent, reaction temperature, drug concentration, drug-lipid ratio and reaction time on the complexation rate were investigated. Box-Behnken design-response surface method was performed to optimize TAF2-phospholipid complex (PC) preparation. The characteristics of TAF2-PC were determined and the pharmacokinetics of TAF2-PC was compared with free TAF2 as control after the oral administration in rats.
| 2. Materials and methods | ▴Top |
2.1. Materials
Root of Eurycoma longifolia (Guangzheng Biological Technology Co. Ltd. Kunming, China); Eurycomanone (mass fraction >95%; Chengdu alfa Biological Technology Co. Ltd. Chengdu, China); DIAION HP-20 resin (Mitsubishi Chemical Holdings. Tokyo, Japan); Methyl alcohol (chromatographically pure; Tianjin heowns Biological Technology Co. Ltd. Tianjin, China); Ethyl alcohol (analytically pure; China National Pharmaceutical Group Corporation. Beijing, China); Acetonitrile (chromatographically pure; Merck KGaA, Darmstadt, Germany); Ultra-pure water was generated using a Millipore Milli-Q Gradient System (Millipore Corp. Billerica, MA, USA); Egg yolk lecithin (Beijing Nuoqi Yasheng Biotechnology Co. Ltd. Beijing, China); Tetrahydrofuran, Acetone, Cyclohexane, Dichloromethane (Tianjin Chemical Reagent Supply and Marketing Co. Ltd. Tianjin, China).
2.2. Preparation and fractionation of Eurycoma longifolia extract
The granule roots of E. longifolia of 100 g were dissolved with 5 times volume of solvent (10% ethyl alcohol) and put in a heating jacket and heat for 4 hours/day, for 5 times consecutively. All of the extracts were collected, concentrated and dried under decompression, the crude extract was obtained and stored at low temperature (4 °C). The crude extract redissolved in a small volume of ethyl alcohol, was then passed through a resin column of Diaion® HP 20 and eluted by gradient mixtures of increasing ratio of ethyl alcohol in water (0:100–100:0) to afford four fractions (TAF1, TAF2, TAF3 and TAF4) (Low et al., 2011), concentrated, dried under decompression, and store at −20 °C.
2.3. Preparation of phospholipid complex
2.3.1. Separation solvent selection
Selection of solvent is one of the critical parameters while preparing drug and phospholipid complex. The solvent should be selected based on the solubility of both drug and phospholipid. It must have the ability to dissolve phospholipid complex and phospholipid but not the drug or to dissolve drugs and phospholipids but not the phospholipid complex. Selecting the proper solvent is very important to calculate the complexation rate (CR) (Yu et al., 2016). Briefly, the TAF2 and TAF2-PC complexes were placed in white vials with sufficient solvents as follow methyl alcohol, acetone, cyclohexane and 1, 4-dioxane, respectively. Vortex over a period of time to observe the dissolution.
2.3.2. Preparation technique of TAF2-phospholipid complex (PC)
Herein, single factor experiment (Zhou et al., 2012)was used to investigate the influence of several major parameters of the complexation rate of TAF2-PC, such as reaction solvent, reaction temperature, reaction drug concentration, drug-lipid ratio and reaction time. Then, the Box-Behnken Design (BBD) coupled with response surface methodology (RSM) with 3 factors and 3 levels was employed to determine the best preparation process of TAF2-PC.
2.3.3. Reactive solvents screening
The complex was initially prepared with TAF2 and egg yolk lecithin at a mass ratio of 1:2, the concentration of TAF2 was 20 mg/mL, the reaction temperature was 40°C, and the reaction time was 1 h. The effects of methyl alcohol, ethyl alcohol, tetrahydrofuran and dichloromethane on the complexation rate were compared.
2.3.4. Reaction temperature screening
The complex was prepared with TAF2 and egg yolk lecithin at a mass ratio of 1:2, the concentration of TAF2 was 20 mg/mL, the reaction time was 1 h, the reaction solvent was ethyl alcohol. The effects of different reaction temperatures (30, 40, 50, 60°C) on the complexation rate were compared.
2.3.5. Reaction TAF2 concentration screening
The complex was prepared with TAF2 and egg yolk lecithin at a mass ratio of 1:2, the reaction temperature was 40°C, the reaction time was 1 h, and the reaction solvent was ethyl alcohol. The effects of different TAF2 concentrations (20, 40, 60, 80 mg/mL) on the complexation rate were compared.
2.3.6. TAF2-phospholipid ratio screening
A 20 mg/mL TAF2 concentration, the reaction temperature was 40°C, 1h reaction time, and anhydrous ethyl alcohol as reaction solvent were set and the effects of mass ratios of different TAF2 and phospholipids (1:1, 1:2, 1:3, 1:4) on the complexation rate were compared.
2.3.7. Reaction time screening
The complex was prepared with TAF2 and egg yolk lecithin at a mass ratio of 1:2, the concentration of TAF2 was 20 mg/mL, the reaction temperature was 40°C, and ethyl alcohol as reaction solvent. The effects of reaction time (1, 2, 3, 4 h) on the complexation rate were compared.
2.3.8. The Box-Behnken Design (BBD) – response surface methodology (RSM)
After examining the influence of each single factor on the experiment results, the three factors with the most significant influence were selected. The Box-Behnken design (BBD) coupled with response surface methodology (RSM) with 3 factors and 3 levels was performed to optimize the preparation process of TAF2-PC.
2.3.9. Preparation of TAF2-PC
TAF2 and PC were combined by solvent evaporation method(Xiao et al., 2006). Briefly, a certain amount of TAF2 and egg yolk lecithin were dissolved in anhydrous ethyl alcohol. The mixture was stirred gently in a water bath for definite time. The solution was evaporated in a rotary evaporator under vacuum, the ethyl alcohol was removed and dried in vacuum for 24 h to obtain the TAF2-phospholipid complex, and store at 4°C.
2.4. TAF2-PC complexation rate
The complexation rates of TAF2-PC was determined as follows. Briefly, approximately 1 g of TAF2-PC was dissolved in 15 mL of the separation solvent and vortex violently. The residue and uncompounded TAF2 were removed by 0.45µm nylon membrane filtration. Concentrated TAF2-PC was obtained by evaporating filtrate. The filtrated precipitate was dissolved and the amount of uncombined TAF2 was determined by high performance liquid chromatography/HPLC system (Waters-e2695, Waters). The complexation rates (CR) (Yu et al., 2016) of TAF2-PC was determined using the following equation:
2.5. Characterization of TAF2-phospholipid complex
There are several characterization instruments available for characterizing drug-phospholipid complexes(Semalty et al., 2012). Morphological evaluation of TAF2 and TAF2-PC was performed by scanning electron microscope, SEM (JSM-6390LV, Jeol Ltd, Tokyo, Japan). In brief, a small piece of double-sided adhesive tape was fixed to an aluminum stub. Powders were sprinkled into a dispersed layer on the stub. Prior to examination, the samples were sputter coated with gold–palladium using an ion sputter (JFC1600, Jeol Ltd, Tokyo, Japan).
To analyze the thermal behavior of the obtained complex, differential scanning calorimeter (DSC) curves were recorded by a DSC instrument (DSC3, Mettler-Toledo International Inc., Switzerland). The accurately weighed samples including TAF2, egg yolk lecithin, the physical mixture and TAF2-PC were sealed into aluminium plate separately. The investigation was carried out over the temperature range 25°Cto 200°Cat a continuous heating rate of 10°C/min in 0.2 mL/min atmospheric nitrogen.
Infrared (IR) spectroscopy is the primary tool to predict any interactions between the drug and phospholipid. IR spectroscopic analyses of TAF2, phospholipid, and TAF2-PC were performed using FTIR-850 Fourier transform-Infrared spectrometer (Tianjin Port East Company). In brief, approximately 1–2 mg of TAF2, lecithin, the physical mixture and TAF2-PC were weighed and placed in a mortar, ground and mixed with KBr pellet at a mass ratio of 1:100, then put into the mold and pressed into tablets for the test. Spectra were recorded in the range 7,800–350 cm−1.
2.6. In vivo pharmacokinetic study of TAF2-PC
Male Sprague–Dawley (SD) rats (220 ± 20 g) were obtained from Animal Center of the Chinese Academy of Science After passing the quarantine by GLP (Good Laboratory Practice) and feeding for 5 days, the experiment was carried out. During the feeding period, the rats were given standard rodent feed and freely drinking water. The experimental design was approved by the Animal Ethics Committee of Tianjin International Joint Institute of Biomedical Sciences. The rats were fasted 24h with free access to water. Twelve animals were divided randomly into two groups (n = 6). TAF2 or TAF2-PC (equivalent to 200 mg/kg of TAF2) was dissolved in 2 mL distilled water and orally administered with a gavage needle. Blood samples of 0.5mL were collected from oculi chorioideae venous of the rats at 0, 0.083, 0.25, 0.5, 0.75, 1, 2, 4, 6, 8 and 10 h after oral administration, respectively. Heparin coated vials containing blood samples were then centrifuged at 8,000 g for 10 min. A 100 µL of the plasma sample were deproteinized by adding 5 µL of 70% perchloric acid. The mixture was mixed for 2 min on a vortex and then centrifuged at 8,000 g for 10 min. The clear supernatant layer was collected, and 20 µL were injected for analysis in the HLPC system(Xiao et al., 2006) to analyze the concentration of eurycomanone.
The maximum concentration (Cmax), time to reach maximum concentration (Tmax), area under the concentration-time curve (AUC0–∞), and elimination half-life (Thalf) were obtained from the plasma concentration–time curve and analyzed by the software Kinetica® 5.0 (Thermo Scientific, American). The results were expressed as mean ± SD. The relative bioavailability (F) of TAF2-PC relative to TAF2 was calculated by the following formula:
2.7. Statistical analysis
All of the experiments were repeated six times. The statistical analysis was carried out by one-way analysis of variance (ANOVA), followed by LSD’s multiple comparison test using SPSS 25.0 (SPSS Inc., Chicago, IL, USA)software. Student’s t-test was used to analyze the differences between two groups in pharmacokinetic study. Data were expressed as mean ± standard deviation (SD). Statistical significance was declared at P<0.05.
| 3. Results and discussion | ▴Top |
3.1. Screening of solvent for TAF2-PC preparation
Table 1 shows the dissolution of TAF2 and TAF2-PC in different solvents. Both methyl alcohol and 1, 4-dioxane have good solubility for TAF2 and TAF2-PC complex and neither of them can be dissolved in acetone. Cyclohexane dissolves TAF2-PC complex well, but does not dissolve TAF2. Selection of solvent is one of the critical parameters while preparing drug and phospholipid complex. The solvent must have the ability to dissolve phospholipid complex and phospholipid but not the drug. Therefore, we select cyclohexane as the separation solvent instead of methyl alcohol, 1, 4-dioxane and acetone.
 Click to view | Table 1. The solubility of TAF2 and TAF2-PC in different solvents |
3.2. The preparation of TAF2-PC
Phospholipid complexes can be prepared by various methods, such as solvent evaporation, supercritical fluid processing, mechanical dispersion, and anhydrous co-solvent lyophilization(Xiao et al., 2006)(Lian and Wang, 2006)Of these, solvent evaporation is relatively mature and easy to perform. In present study, TAF2−PC was prepared using a solvent evaporation method, and the optimal complexation parameters such as reaction solvent, TAF2 to phospholipid ratio, temperature, and time were determined by single factor test.
A number of solvents were examined as the complexation medium to formulate TAF2-PC. This study showed that the methyl alcohol has the highest complexation rate (88.0 ± 0.42), followed by ethyl alcohol, dichloromethane, and tetrahydrofuran (85.3 ± 1.50, 75.3 ± 2.36, and 64.6 ± 2.41), respectively (Table 2). The complexation rate of both methyl alcohol and ethyl alcohol are significantly higher than dichloromethane and tetrahydrofuran,respectively. The ethanol was finally chosen as the reaction solvent, due to the toxicity of methanol that may not fully removed from the product, which result in the excessive solvent residue.
Click to view | Table 2. The effect of reaction solvent on complexation rate |
Different reaction temperatures were applied to obtain the optimum complexation rate. The results showed that the relatively higher complexation rate were achieved at 40 to 50°C compared with other temperatures, as indicated in table 3. The relatively lower temperature of 40°C was determined as the optimized temperature of present study, due to the well know trend that the low temperature the less chances to produce the impurities and degradation products.
Click to view | Table 3. The effect of reaction temperature on complexation rate |
The drug concentration of fixed drug carrier ratio is another important factor that may significantly affect the complexation rate of the final product. The result of present study suggested that the loading concentration of 40 mg/mL have reaches the saturated level. The complexation rates were not improved by increasing the drug loading anymore (Table 4).
Click to view | Table 4. The effect of reaction drug concentration on complexation rate |
The drug carrier ratio is also necessary to be evaluated, as the entire volume of single dose, the cost of the carrier, and the complexation rate need to be collectively balanced. The results in table 5 suggest that the Drug-phospholipid ratio of 1:2 and 1:3 result in very significant higher complexation rate compared with other ratios. However, the appearance of the complex showed that the higher the proportion of phospholipids, the more viscous observed which may lead to t handling and storage problems accordingly. It was thus suggested that the ratio of 1:2 was applied for the subsequent studies.
Click to view | Table 5. The effect of drug - phospholipid ratio on complexation rate |
The complexation rates of phospholipid complexes obtained at different reaction times is shown in Table 6. It suggested that there is no significantly increasing of complexation rate after 1h.
Click to view | Table 6. The effect of reaction times on complexation rate |
3.2.1. Box−Behnken Design
According to the results of the single-factor test, the reaction time had no significant effect on the complexation rate. Thus, three independent variables including drug - phospholipid ratio, reaction temperature and reaction drug concentration were selected to design the Box-Behnken response surface experiment with three factors and three levels. The factor levels and coding table of the response surface test were shown in Table 7, and the response surface test scheme and results were shown in Table 8.
Click to view | Table 7. Experimental ranges and levels of the ratio drug to phospholipid (A) and reaction temperature (B) and drug concentration (C) |
Click to view | Table 8. Response surface test scheme and results |
As shown in the analysis of variance (ANOVA) of the quadratic response surface model (Table 9), the prediction model P value is less than 0.0001, indicating that the model is extremely significant, indicating that the quadratic regression model has a good fitting degree. From the difference of F value, A > C > B was obtained. Therefore, the influence of the three factors on the compound rate was the drug-phospholipid ratio > reaction drug concentration > reaction temperature.
Click to view | Table 9. Analysis of variance of quadratic response surface model |
Thereafter, the final equations in terms of actual factors (the ratio drug to phospholipid; reaction temperature; and drug concentration) and coded factors (A, B, C) can be represented as the following equation:
Y = 93.85 + 5.26A + 0.90B + 3.79C + 2.24AB + 2.39AC − 1.22BC − 10.93A2 − 7.01B2 − 8.20C2
The regression coefficient (R2) of the model was 0.9958, the SNR was 35.496. It suggested that the prediction model is real and reliable, thus predicts the real situation well.
The software Design Expert 8.0 (statease) was used to draw the 3D response surface diagram of the effect of any two of the three factors on the complexation rate. The results showed the complexation rate increased and then gradually decreased following the increasing of reaction temperature and the drug-phospholipid ratio (Figure 1A), drug concentration and the drug-phospholipid ratio (Figure 1B), and drug concentration and reaction temperature (Figure 1C), respectively.
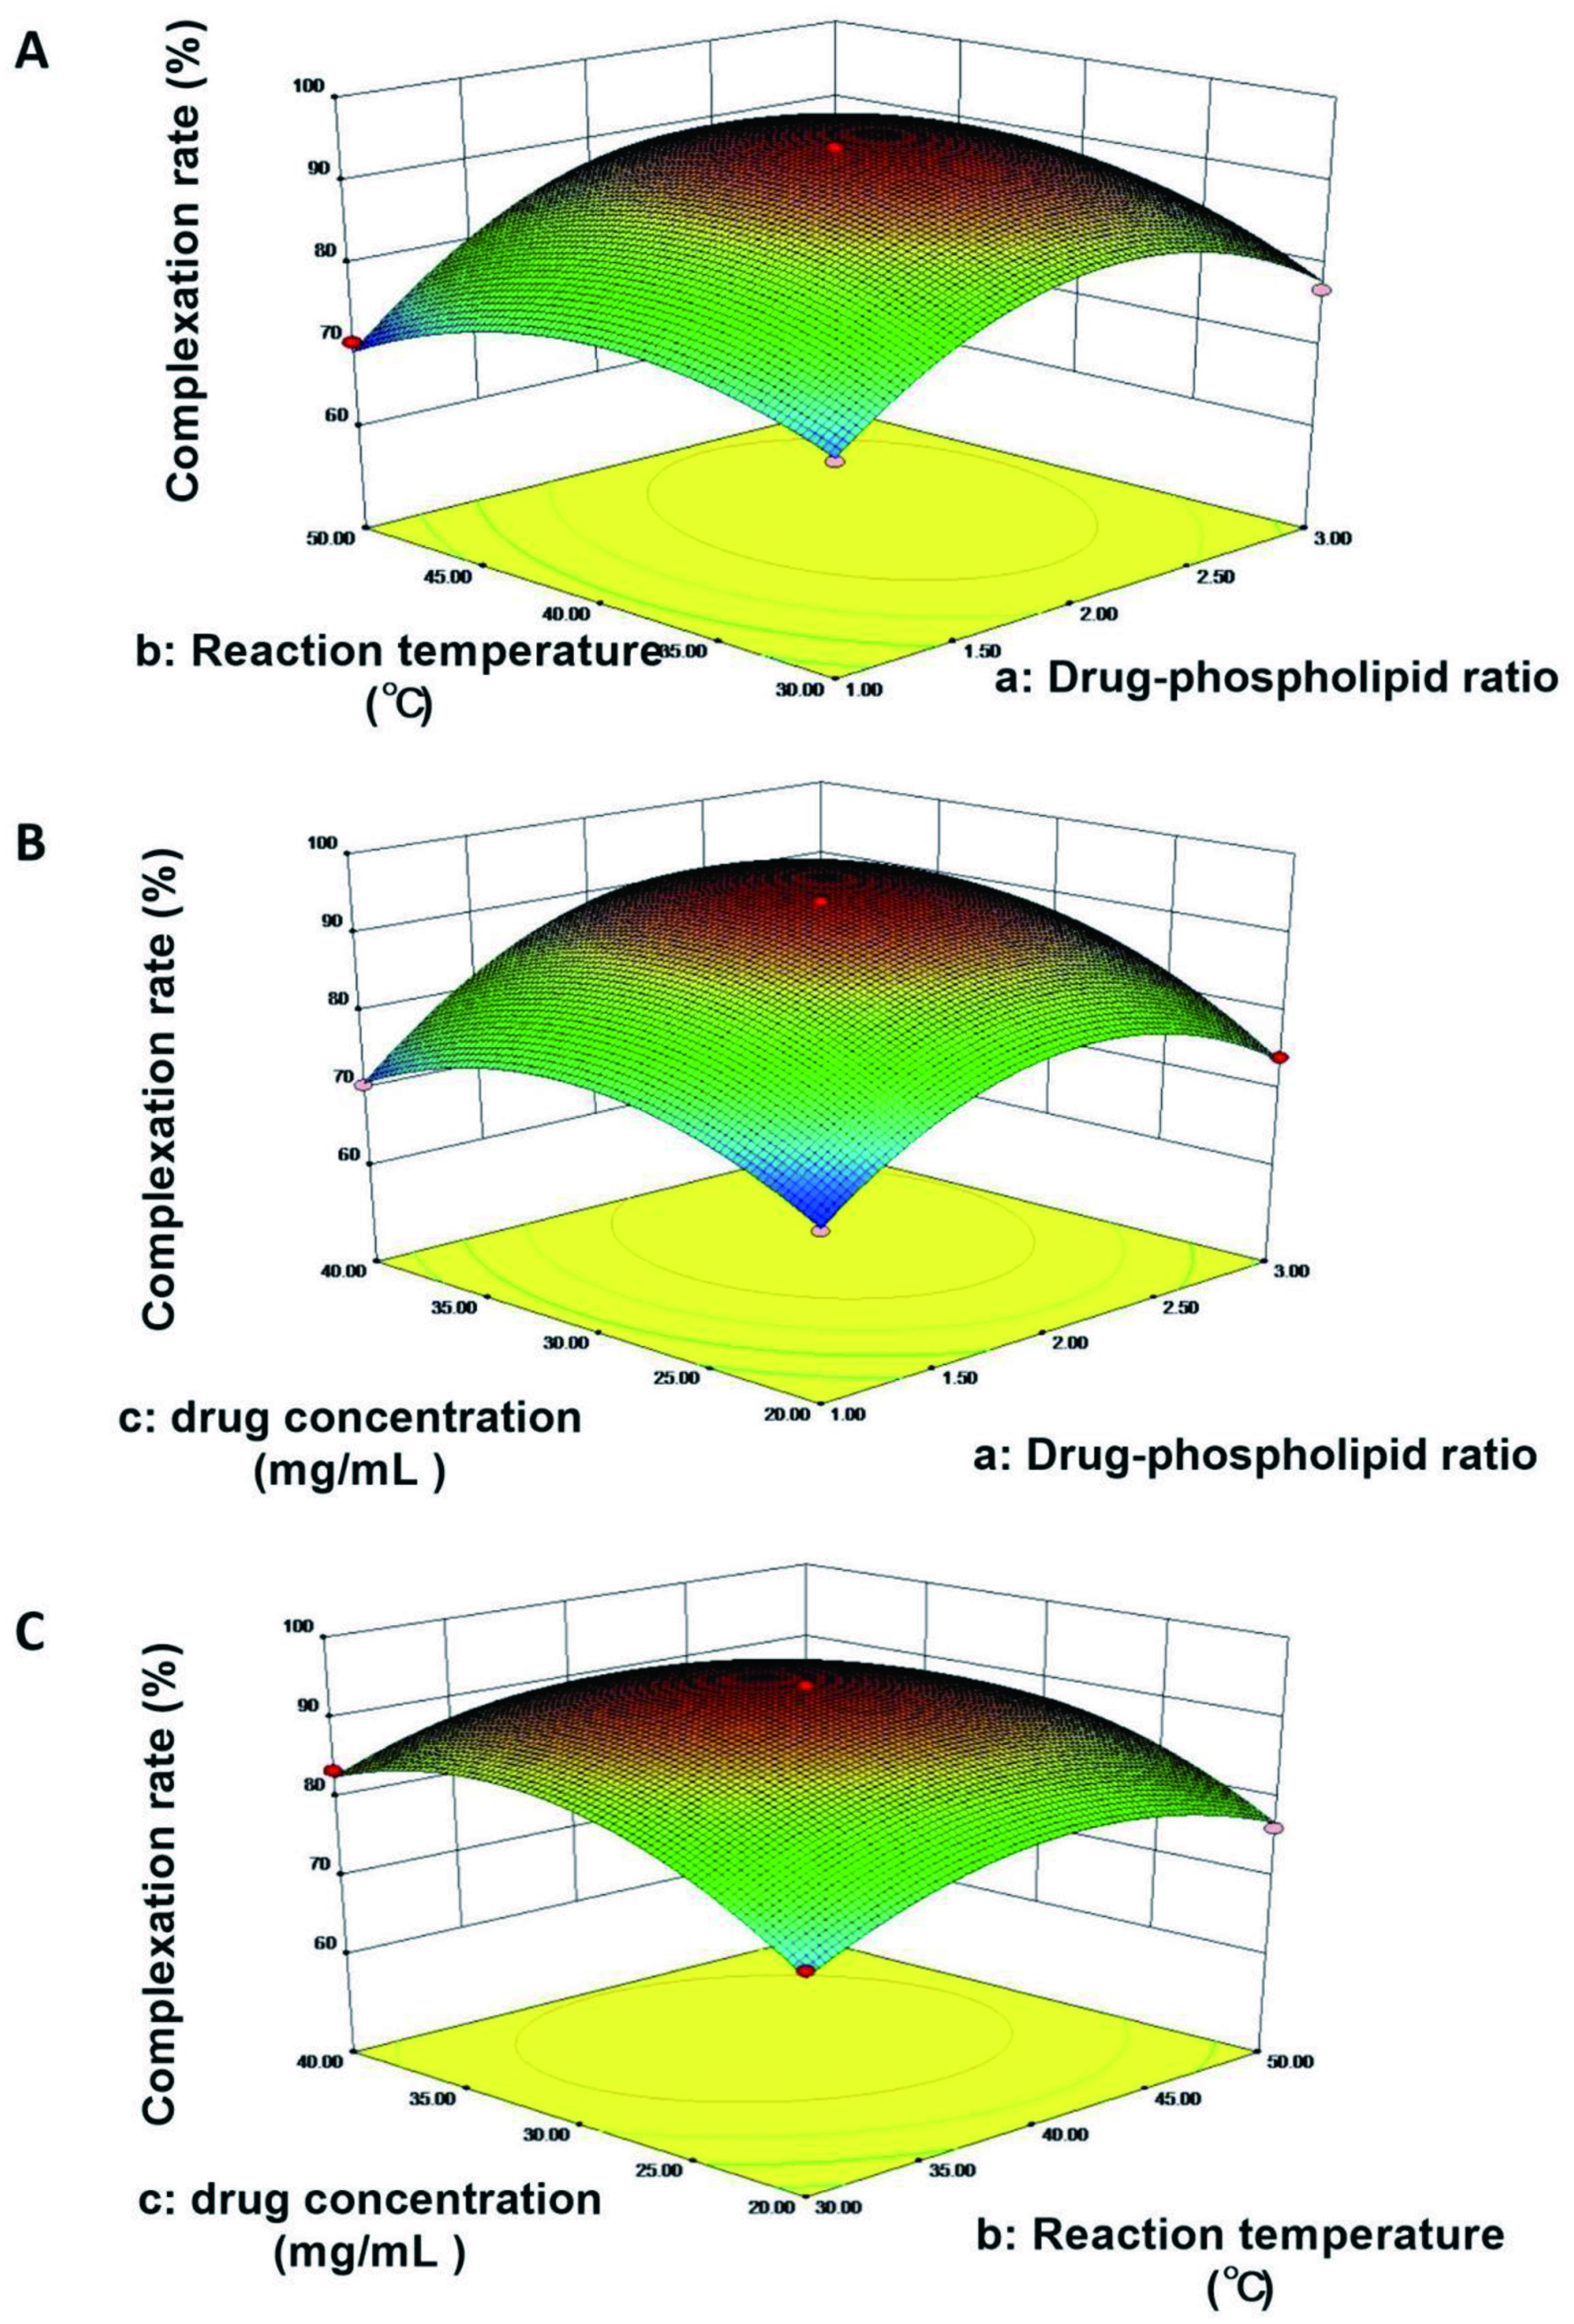 Click for large image | Figure 1. 3D response surface diagram. (A) The effects of reaction temperature (b) and the ratio drug to phospholipid (a) on the complexation rate; (B) The effects of drug concentration (c) and the ratio drug to phospholipid (a) on the complexation rate; (C) The effects of drug concentration (c) and reaction temperature (b) on the complexation rate. |
According to the model prediction, the optimized preparation formula was as follows: the drug-phospholipid ratio was 2.28, reaction temperature was 40.85°C, drug concentration was 32.66 mg/mL, and the complexation rate is predicted to be 95.12%.
According to the predicted optimal formulation conditions, we prepare three samples of TAF2-PC and the complexation rate was 95.04 ± 0.40% (n=3), which was highly consistent between the real value and the predicted value, which was higher than that of all the response surface experimental groups, indicating that the predicted results were accurate and the prescription process was optimal.
3.3. Characterization of TAF2-PC
3.3.1. Scanning electron microscope (SEM)
The surface morphology of representative samples was represented in Figure 2. The results demonstrated that the appearance of free TAF2 particles is irregular, which is composed of small crystalline particles and polydisperse aggregates (Figure 2A). When TAF2 form a complex with phospholipids, it showed significantly change in morphology and shape. They form granules of different sizes with the absence of crystallinity of TAF2 (Figure 2B). It suggested that the TAF2 molecules may form amorphous mixture with phospholipids, the molecular surface is covered by phospholipid molecules, losing the original crystal structure.
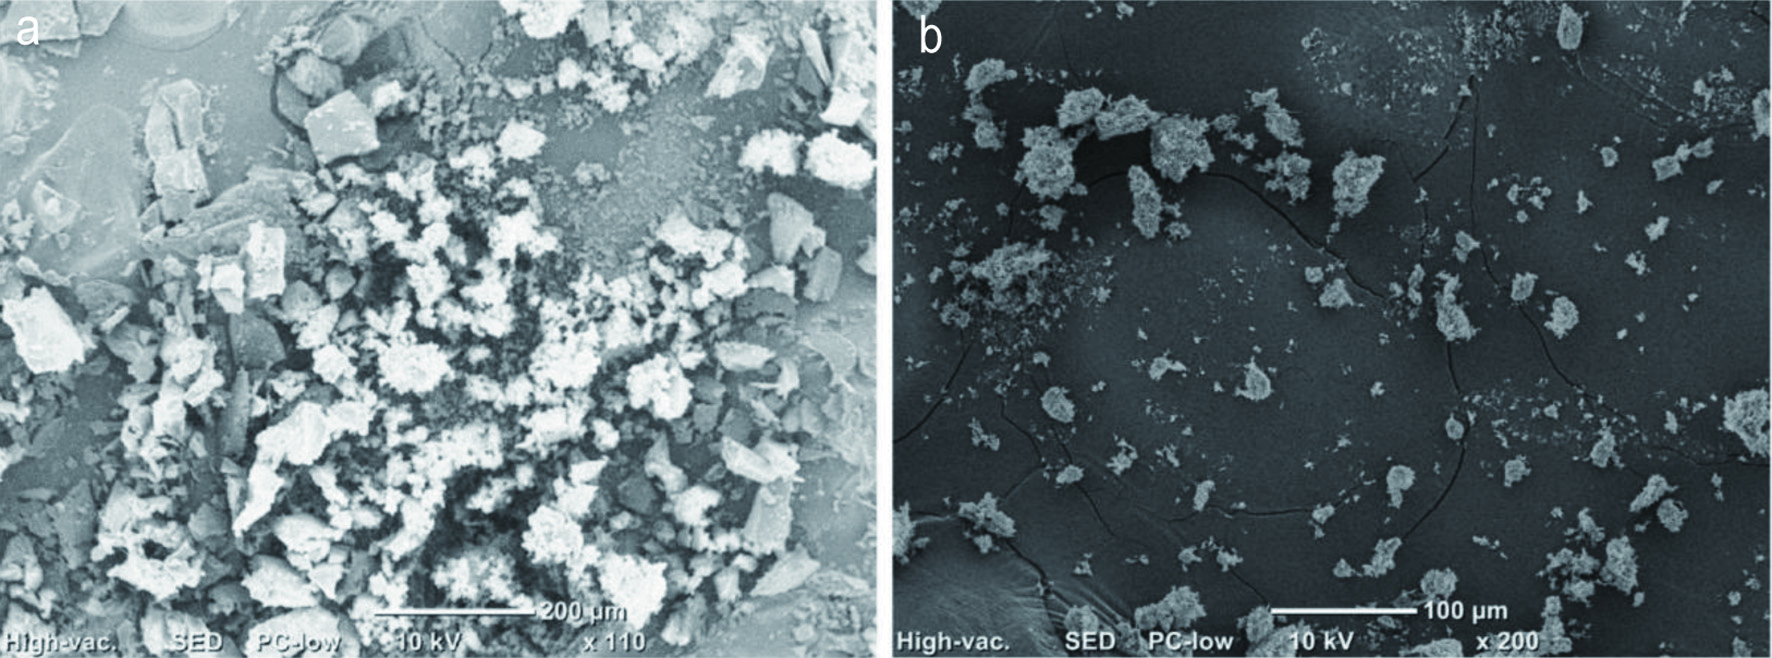 Click for large image | Figure 2. Scanning electron microscope (SEM) micrographs of (A) TAF2; (B) TAF2-PC. |
3.3.2. Differential scanning calorimeter (DSC)
DSC was performed to analyze the interactions between multiple components of a drug preparation. TAF2 showed endothermic peak group between 99.8°Cand 127.8°C (Figure 3A), this is related to TAF2 is a mixture of a variety of quassinoids compounds. The phospholipids had a melting point peak at 153.3°C (Figure 3B). In the physical mixture of TAF2 and phospholipids, an endothermic peak was observed approximately 130.5°C(Figure 3C), which was close to the phase transition point of TAF2 at 127.8°C. It was suggested that following by increasing temperature, the phospholipids melt, the drug dissolves in the phospholipids and partially forms phospholipid complexes, which making the slightly change of endothermic peak. Thermal analysis diagram of TAF2-PC shows wide endothermic peak at 65.2°C(Figure 3D). The original peaks of TAF2 and phospholipid disappeared from the thermal spectra of TAF2-PC and the temperature of phase transition was lower than that of TAF2 and phospholipid, the decrease in melting point and enthalpy may be due to the decreased crystallinity of the drug (Devendra et al., 2012).The non-polar part of TAF2 binds to lecithin by hydrogen bonding or van der Waals interaction, which makes TAF2 highly dispersed among the molecules of lecithin, reduces the phase transition temperature of TAF2 and there are no TAF2 drug crystals in the phospholipid complex. Therefore, it is assumed that TAF2 forms a phospholipid complex with lecithin.
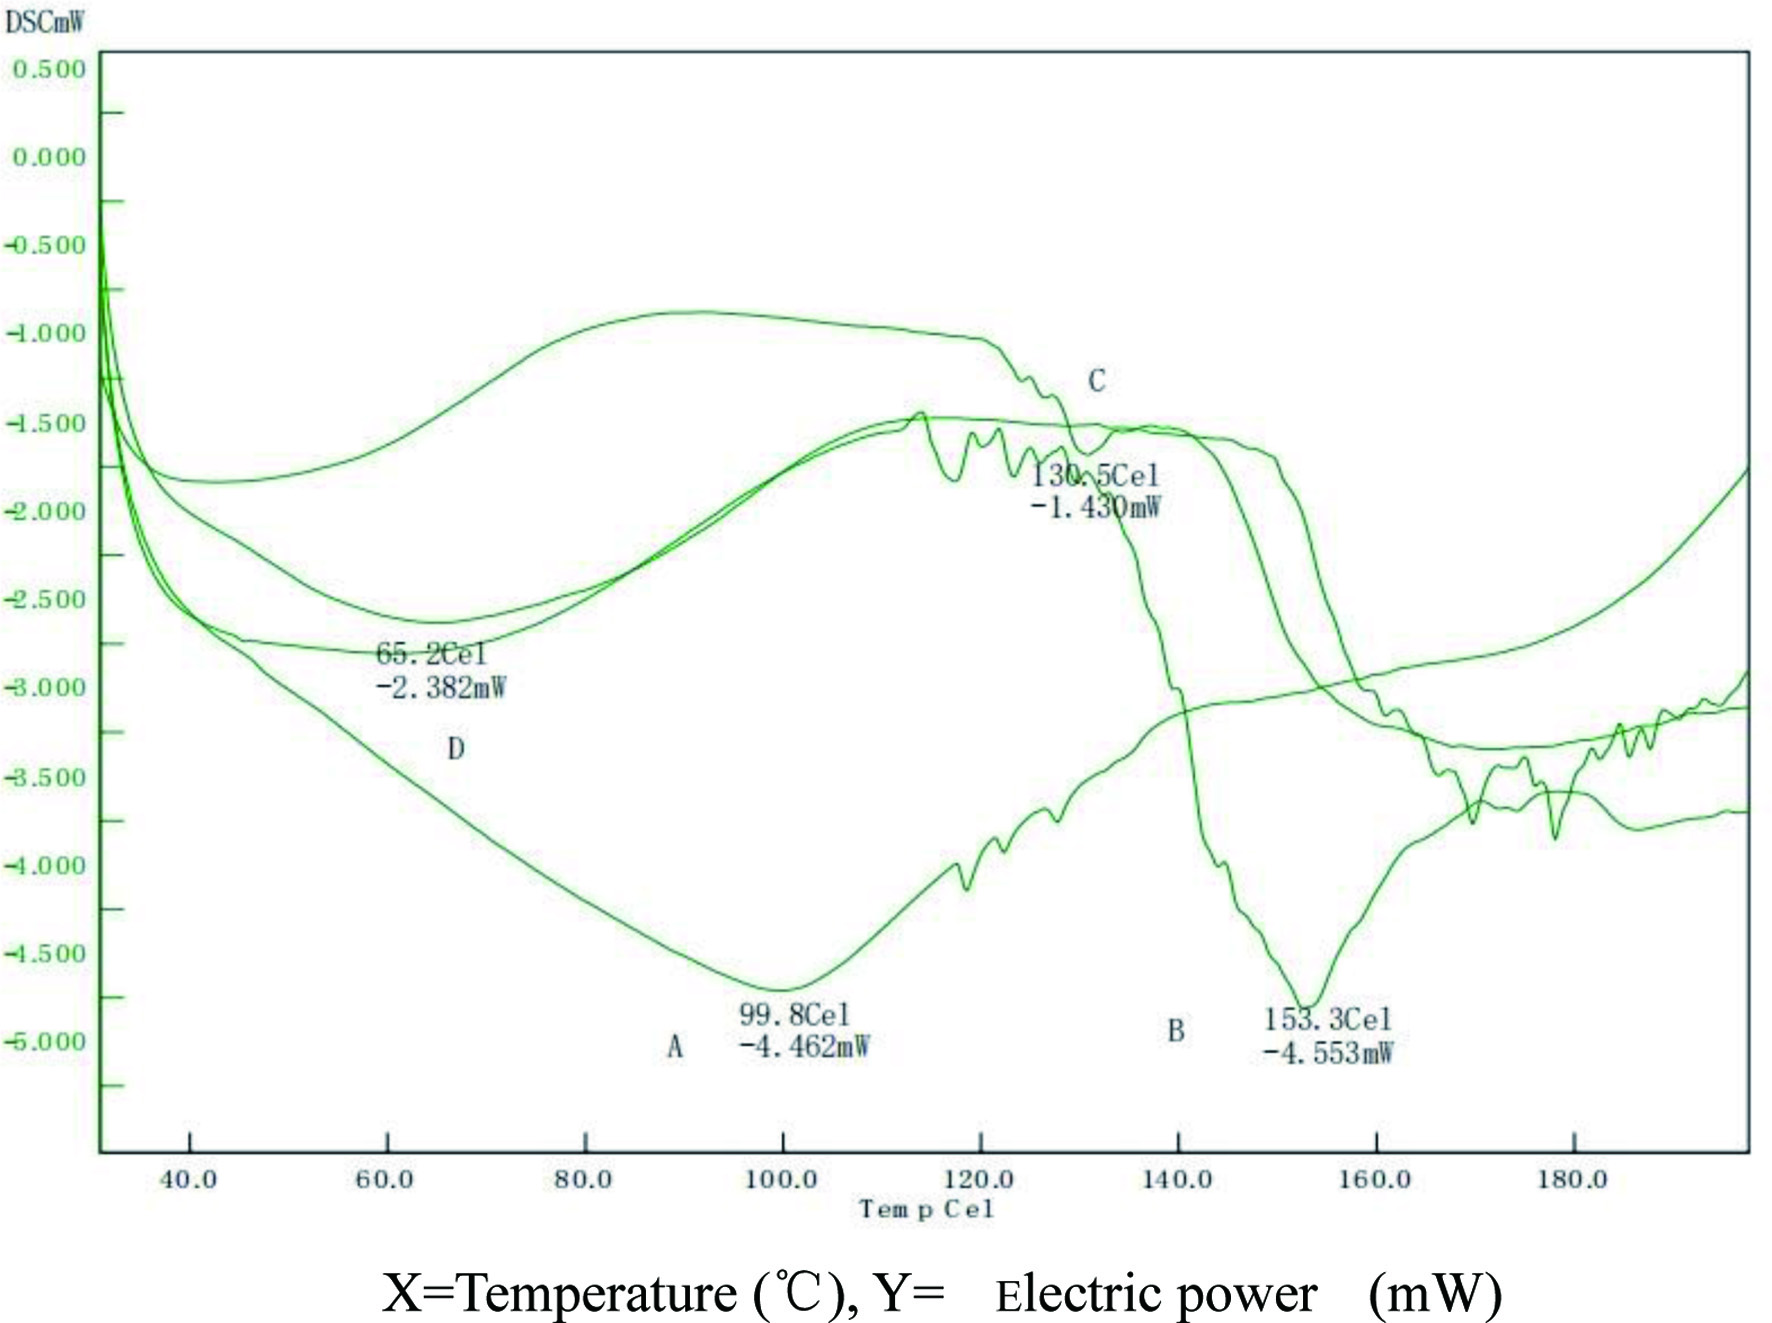 Click for large image | Figure 3. Differential scanning calorimeter (DSC) pattern of TAF2 (A), lecithin (B), A physical mixture of TAF2 and lecithin (C), and TAF2-PC (D). |
3.3.3. Fourier transform infrared spectroscopy (FTIR)
The FTIR spectrum of TAF2 revealed a broad peak at 3,419 cm−1 (Figure 4A), representing the -OH group on the ring structure, and the C-H stretching signal at 2,900 cm−1. The absorption peak near 1,729 cm−1 represents the C=O stretching signal of fatty acid ester, the C=C stretching signal at 1,670 cm−1, and the C-O stretching signal at 1,055 cm−1. These signal peaks are mostly consistent with the structure of diterpenoid rings of quassinoids compounds.
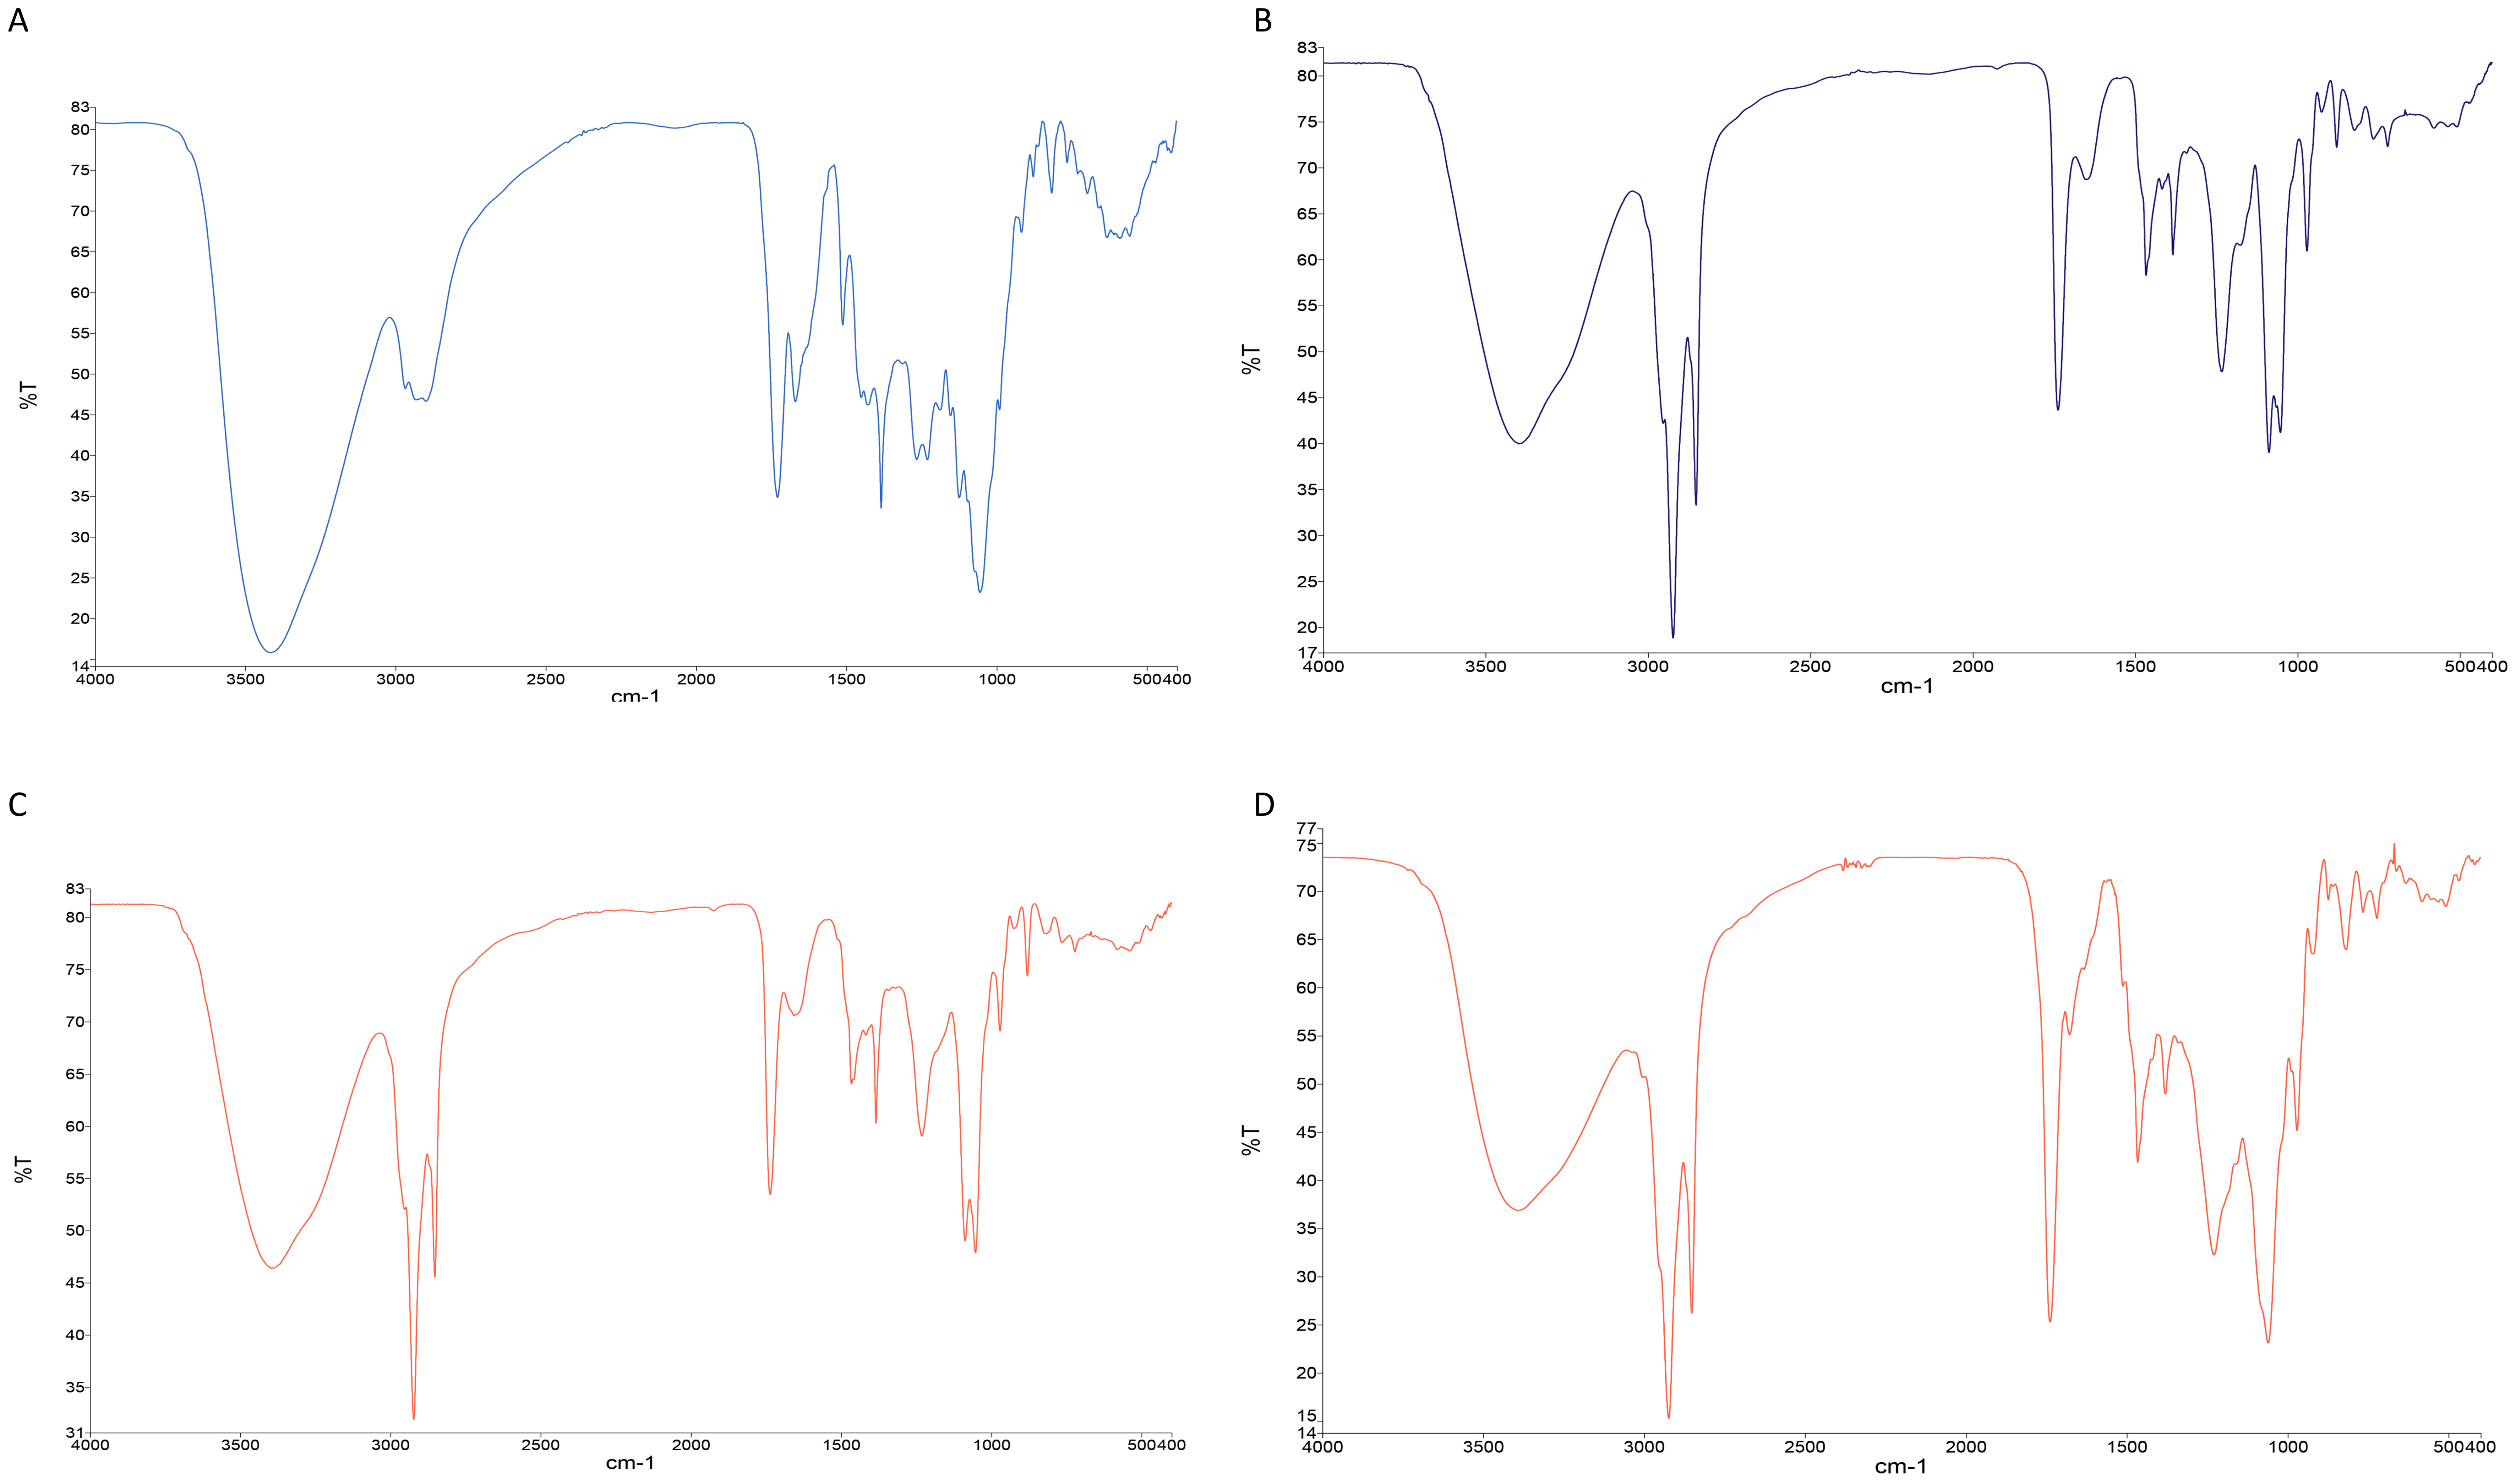 Click for large image | Figure 4. FTIR spectroscopy analysis of TAF2 (A), lecithin (B), the physical mixture of TAF2 and lecithin (C) and TAF2-PC (D). |
FTIR spectra of lecithin (Figure 4B) showed the characteristic C-H stretching signal of long-chain fatty acids at 2,924 cm−1 and 2,854 cm−1, respectively. The absorption peak of C=O of fatty acid ester at 1,738 cm−1, the absorption peak of P=O at 1,233 cm−1, the absorption peak of P-O-C at 1,087 cm−1 and the absorption peak of -N+(CH3)3 at 970 cm−1 were observed in the spectrum.
The FTIR spectra of the mixture of TAF2 and lecithin (Figure 4C) are essentially superposition of the main absorption peaks of TAF2 and lecithin.
In the FTIR spectrum of TAF2-PC (Figure 4D), the -OH absorption peak of TAF2 changed from 3,419 cm−1 to 3,391 cm−1, the absorption peak of C=C changed from 1,670 cm−1 to 1,678 cm−1, and the absorption peaks at 1,512 cm−1 and 1,153 cm−1 disappeared. The P=O characteristic peak of phospholipids changed from 1,233 cm−1 to 1,228 cm−1, and the C-H stretching signal peak of phospholipids did not change. These results suggested that the phospholipid complex is not a simple physical mixture between quassinoids and phospholipids, but is bound by intermolecular interaction. Phospholipid complexes may be formed by the interaction between the polar ends of phospholipids and the hydroxyl groups and the carbon-carbon double bonds of the quassinoids.
3.4. Pharmacokinetic studies of TAF2-PC in SD rats
The plasma concentration-time curves of eurycomanone which obtained after single oral administration of TAF2 or TAF2-PC in rats were shown in Figure 5 and the main pharmacokinetic parameters of eurycomanone were summarized in Table 10. The mean value of the Cmax of eurycomanone in the TAF2-PC group was higher than that in the TAF2 group, 0.50 ± 0.13µg/mL vs 0.27 ± 0.16µg/mL, respectively. Time period to attain the maximum plasma concentration (Tmax) of the TAF2-PC group was 0.46 ± 0.29 h, whereas that of the TAF2 group was 0.32 ± 0.26 h. Tmax was delayed in the TAF2-PC group compared with the TAF2 group, which may be due to the continuous release of the drug from the phospholipid complex or the delayed uptake of the drug by intestinal cells and M cells (Yu et al., 2016). Passive transport was the main absorption mode of eurycomanone. Due to its poor lipid solubility, it is difficult to penetrate the phospholipid bilayer of gastrointestinal cells, resulting in poor absorption. The phospholipid complex of eurycomanone ameliorated the lipid solubility of TAF2, enhanced the affinity with the cell membrane, thus the membrane absorption of TAF2 was improved, and the blood drug concentration in rats was increased. The improvement of oral bioavailability is the key factor to determine the further application of new drugs in clinical trials. The relative bioavailability of TAF2-PC to TAF2 was 209.20%, suggesting that TAF2-PC improved the absorption of TAF2 and significantly increased the relative bioavailability (P < 0.05).
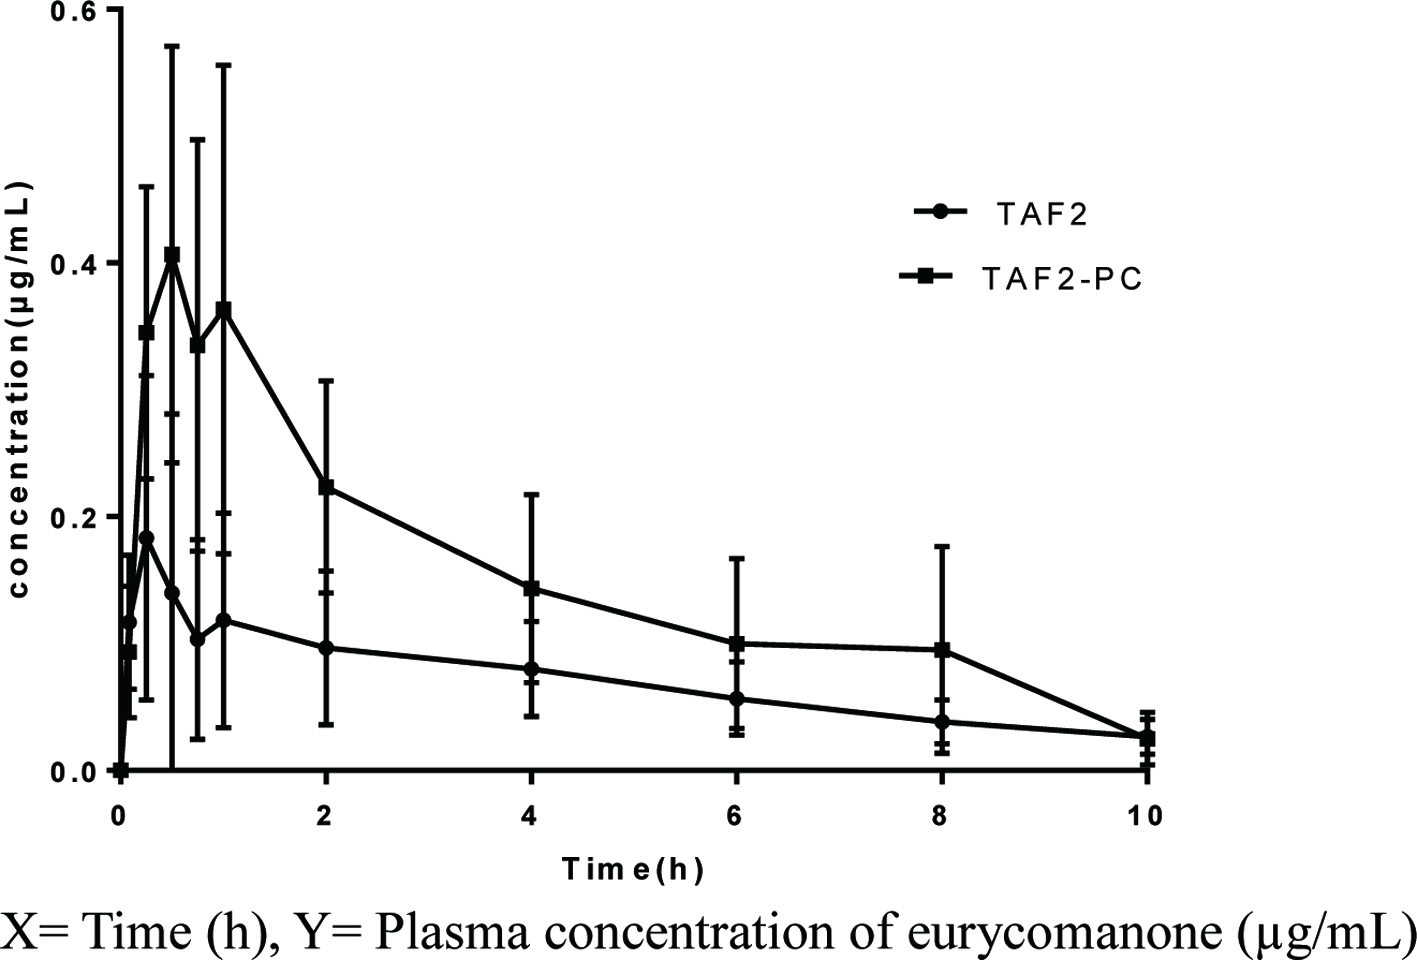 Click for large image | Figure 5. Mean plasma concentration - time curves of eurycomanone after a single oral administration of TAF2 or TAF2-PC in rats. Each value represents the mean ± SD, n=6. |
Click to view | Table 10. Pharmacokinetic parameters after oral administration of TAF2 or TAF2-PC in rats |
| 4. Conclusion | ▴Top |
The bioavailability is generally determined by the solubility and permeability of the active compounds, except that the P-glycoprotein (P-gp) is also involved in the absorption process. The hydroxyl groups of eurycomanone make it very polar (Figure 6). Thus, the permeability is the only critical character that may determine the bioavailability, as eurycomanone is not the substrate of P-gp. In this present study, quassinoid-phospholipid complex was successfully prepared by solvent evaporation method. Its preparation method was modified by performing single factor test for screening and optimized by the Box-Behnken design response surface method. Using anhydrous ethyl alcohol as the reaction solvent, it found that the reaction temperature, reaction drug concentration and drug to phospholipid ratio had significant effects on the complexation rate. Based on BBD response surface methodology results showed that the effect of reaction temperature on the complexation rate was the lowest among three factors, while the effect of drug phospholipid ratio and reaction drug concentration were ranked first and second, respectively. The optimal preparation process was predicted as follows: drug-phospholipid ratio of 2.28, reaction temperature of 40.85°C, drug concentration of 32.66 mg/mL. The predicted complexation rate was 95.12%. These prediction complexation rate results which was proven to be accurate by the prescription verification experiment. SEM results showed change in morphology and shape of TAF2-phospolopid complex, which confirmed by the absence of crystallinity of TAF2. The results of DSC showed that the original peaks of TAF2 and lecithin disappeared from the thermal spectrum of TAF2-PC, and the phase transition temperature was lower than that of TAF2 and lecithin. The complex demonstrated amorphous characteristics, indicating that TAF2 and lecithin formed phospholipid complex. IR spectra revealed that the phospholipid complex was formed by intermolecular binding of quassinoids and phospholipid molecules, rather than simple mixture between them. In summary, it can be confirmed that TAF2 and phospholipids form phospholipid complex. The pharmacokinetics of TAF2-PC and bioavailability of TAF2 were studied in male SD rats. The results showed that the phospholipid complex of eurycomanone significantly enhanced the oral absorption of TAF2, and the relative bioavailability was significantly increased (P < 0.05).
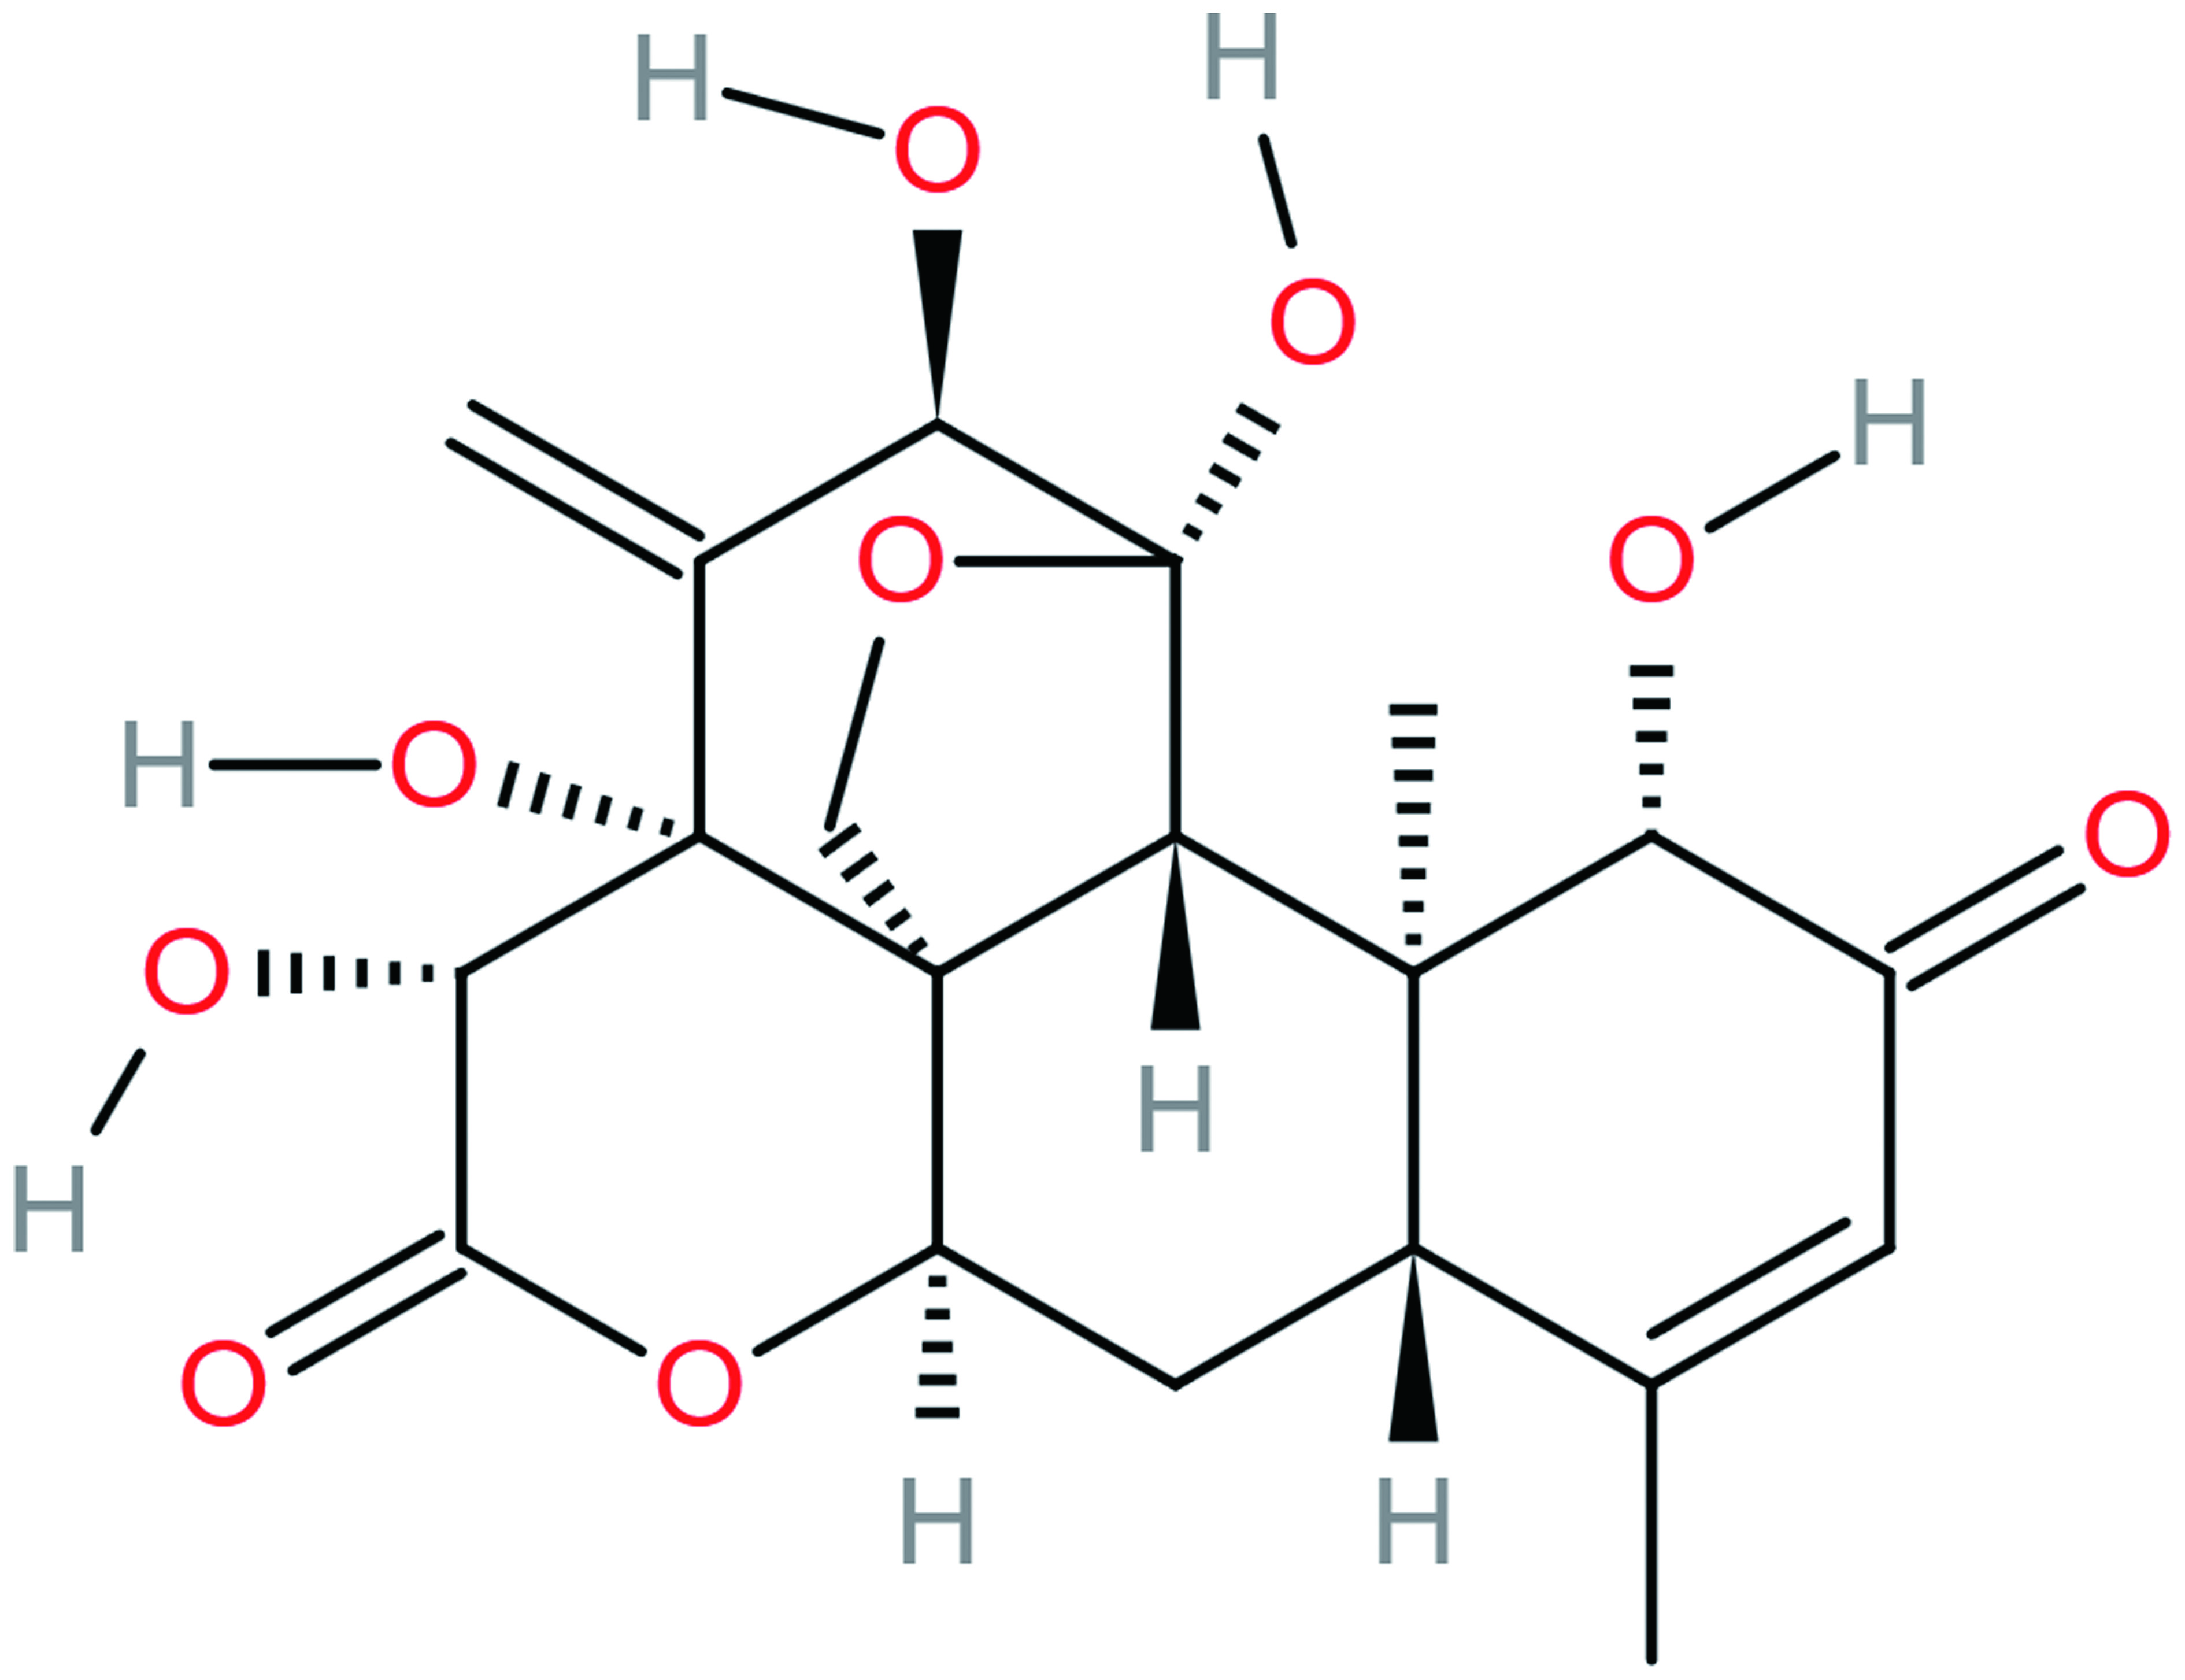 Click for large image | Figure 6. Chemical structure of Eurycomanone. |
In summary, we successfully prepared the quassinoids-phospholipid complex and in vivo study have shown that the develop TAF2-PC significantly improved the oral absorption and bioavailability of TAF2 which to overcome the limited absorption of TAF2.
These authors contributed equally to this work.
| References | ▴Top |