| Journal of Food Bioactives, ISSN 2637-8752 print, 2637-8779 online |
| Journal website www.isnff-jfb.com |
Original Research
Volume 14, June 2021, pages 60-74
Characterization and profiling of polyphenolics of Brassica microgreens by LC-HRMS/MS and the effect under LED light
Oday Alrifaia, b, Lili Matsa, Ronghua Liua, Honghui Zhua, Xiuming Haoc, Massimo F. Marconeb, Rong Tsaoa, *
aGuelph Research & Development Center, Agriculture and Agri-Food Canada, 93 Stone Road West, Guelph, Ontario, Canada, N1G 5C9
bDepartment of Food Science, Ontario Agricultural College, University of Guelph, Guelph, Ontario, Canada, N1G 2W1
cHarrow Research & Development Center, Agriculture and Agri-Food Canada, 2585 County Road 20, Harrow, Ontario, Canada, N0R 1G0
*Corresponding author: Rong Tsao, Guelph Research & Development Center, Agriculture and Agri-Food Canada, 93 Stone Road West, Guelph, Ontario, Canada, N1G 5C9. E-mail: rong.cao@canada.ca
DOI: 10.31665/JFB.2021.14268
Received: May 13, 2021
Revised received & accepted: June 15, 2021
| Abstract | ▴Top |
An untargeted approach to profiling of polyphenolics of Brassicaceae microgreens was employed to characterize the phenolic composition in microgreens grown under 8 different treatments of combined amber (590 nm), blue (455 nm), and red (655 nm) LED, using full MS and HRMS/MS-ESI. Hydroxycinnamic acid (HCA) derivatives predominated the pool of phenolics in the microgreens, followed by free phenolic acids and flavonol glycosides/acylglycosides, with most of the HCA derivatives existing as malate esters. Most HCA malates in mustard (Barbarossa) and all HCA malates in mizuna (red kingdom)/ radish (red Rambo, organic) were significantly decreased under most treatments, whereas all malates were overall increased under combined lighting in radish (red Rambo), mustard (Garnet Giant), mizuna (organic), Pac choi (red Pac) and mustard (Scarlet Frills). The present study demonstrated that amber in combination with blue and red LED contributed to the altered phenolic profile and increase and/or decrease in quantity of certain phenolic compounds, particularly the HCA malates.
Keywords: Amber light; Polyphenolics; Phytochemicals; Light-emitting diodes; Microgreens; LC-HRMS/MS-ESI
| 1. Introduction | ▴Top |
Polyphenolics are secondary metabolites widely distributed as aglycones or their glycosides or acylglycosides in plants. A wide range of research has been conducted on dietary polyphenolics mainly due to their roles in human health (Zhang and Tsao, 2016). Brassicaceae (or Brassica, Crucifers) vegetables are the most consumed globally with several reports highlighting their importance for preventing cardiovascular diseases and certain cancers due to their antioxidant properties (Lin et al., 2011). Extensive research has shown that major polyphenolics in Brassica vegetables exist as glycosides or acylglycosides of quercetin (Qn), kaempferol (Km) and isorhamnetin (Iso) with various sugar moieties occurring as mono-, di-, tri-, tetra- and penta-glucosides. The acylated flavonoids are mainly with hydroxycinnamic acids (HCA), particularly coumaric, caffeic, sinapic and ferulic acids (Olsen et al., 2009; Sun et al., 2013). Recent review papers have compiled numerous studies pointing towards the neuroprotective and anti-carcinogenic effects of flavonoids, suggesting a diet containing these compounds may be part of the treatment for Alzheimer’s disease and several cancers (Kim and Park, 2021; Ponte et al., 2021).
Optimal lighting for microgreens production is a growing topic as energy-efficient LED technology has advanced significantly and is now equipped in plant factories together with advanced greenhouse systems and hybrid lighting (Alrifai et al., 2019; Kyriacou, et al., 2019). Red light (RL) and blue light (BL) wavebands are deemed the most efficient for driving metabolic changes in plants, including phytochemical biosynthesis for defense-related activities, compared to other components of the visible light spectrum. These lights are absorbed by chlorophyll photosynthetic pigments responsible for accumulating metabolites of polyphenols, carotenoids and glucosinolates (Alrifai et al., 2019). We previously reported on the effects of amber LED on total phenolic contents and total antioxidant activities, and discussed the need to identify further information, particularly the phenolic composition, on the yellow-orange (mid-point amber light at 590 nm) light range to differentiate from commonly reported effects in the broad 500–600 nm green light range (Alrifai et al., 2020; Alrifai et al., 2021).
In the present paper, various LED treatments of combined AL, RL and BL were used to grow eight microgreens of Brassica vegetables to understand the response of individual polyphenolic compounds. Our previous report analyzed total contents of overall polyphenolics, including its sub-groups, and therefore the current study analyzes the contributions of these individual polyphenolics in the overall pool and their accumulation under the LED lights (Alrifai et al., 2020). This is the first study of its kind to analyze the accumulation of individual phenolics under various combinations of amber, red and blue LED in Brassica microgreens. The methods and results will better help the understanding of LED-regulated biosynthesis of these individual health-promoting polyphenolics. Although phytochemical profiles have been reported for mature vegetables of Brassica species, detection of these polyphenolics in microgreens grown under amber (590 nm) light is reported here for the first time.
| 2. Materials and methods | ▴Top |
2.1. Plant materials, chemical reagents and growth chamber lighting
Eight varieties of Brassica microgreens, including 2 mizunas [organic and red kingdom (Brassica rapa var. Japonica), MO, MR]; Pac choi (Brassica rapa var. Chinensis), PC; 2 radishes [red Rambo and red Rambo organic (Raphanus sativus), RR, RO], and 3 mustards [Scarlet Frills, Barbarossa and Garnet Giant (Brassica juncea), MSF, MB, MG] were grown at the Harrow Research & Development Centre, Agriculture and Agri-Food Canada (Harrow, Ontario, Canada) similar to our previous report (Alrifai et al., 2020). Seeds of microgreens purchased from Johnny’s Selected Seeds (Winslow, ME, USA) were sown in 100% Canadian Sphagnum Peat Moss (pH 6–6.2, 1,400 ms/M, average quantity of nutrient (ppm) N, 110; P, 32; K, 170; and other microelements Ca, Mg, Fe, S, Mn, ASB Greenworld Ltd., Mount Elgin, ON, Canada) for germination. Trays were submerged in fertilizer and subsequently moved into a germinating room (24 °C; 90% relative humidity (RH); 16 h photoperiod). General maintenance was consistent (i.e. water sprayed, irrigated and trays rotated). Seeds were germinated for 2–3 d, followed by 13–14 d growth period in the chambers. Microgreens were harvested after 15–16 d. Upon first sign of germination, the plantlets were moved to the chambers and were grown until harvest under eight treatments (2 treatments/chamber; 16 °C; 70% RH; 16 h photoperiod). Each growth chamber was equipped with amber (A, 590 nm), blue (B, 455 nm) and red (R, 660 nm) LED in different ratios (%): 4.73A:20.52B:74.36R; 6.74A:22.68B:70.25R; 9.51A:24.13B:65.91R; 12.02A:26.26B:61.14R; 4,12.57A:44.31 B:42.39R; 14.53A:30.18B:51.82R; 18.45A:33.51B:47.48R; and 39.46A:58.94B:0.57R. All microgreens were grown in triplicate over three separate trials. Microgreens were harvested at their base, packed in air-tight plastic bags and stored in −80 °C and then lyophilized for extraction and chromatographic analyses. Details related to sample processing and extraction and chamber cabinet settings were similar to that reported in our previous papers (Alrifai et al., 2020; Alrifai et al., 2021). Single extractions were carried out for each sample for a total of 3 replicates per variety. HPLC grade methanol (MeOH), formic acid and acetonitrile (ACN) were purchased from Caledon Laboratories (Georgetown, ON, Canada). All chemical reagents used were of analytical grade.
2.3. Identification of phenolics by LC-HRMS/MS
An untargeted approach to profiling combining full MS and MS-MS methods was used to obtain reliable peak area and fragmentation data in one run. Pooled quality control (QC) samples for each microgreen were created by combining 10 µL of each sample. Samples were randomized before analysis and QC samples were periodically inserted into sequence and analyzed in DDMS2 mode (Top N=15) with NCE set at 30. Analysis was carried out in negative ionization mode to ionize polyphenolic analytes in acidified solvent. LC-HRMS/MS analysis was performed using a Thermo® Scientific Q-Exactive™ Orbitrap mass spectrometer equipped with a Vanquish™ Flex Binary UPLC System (Waltham, MA, USA). Data were acquired using Thermo Scientific™ Xcalibur™ 4.2 software and Thermo Scientific™ Standard Integration Software. The chromatographic separation was performed on a Kinetex XB-C18 100A HPLC column (100 × 4.6 mm, 2.6 µm, Phenomenex Inc., Torrance, CA, USA). The binary mobile phase consisted of solvent A (99.9% H2O/0.1% formic acid, v/v) and solvent B (94.9% MeOH/5% ACN/0.1% formic acid, v/v/v). The following solvent gradient was used: 0–5 min, 0% to 12% B; 5–15 min, 12% to 23% B; 15–30 min, 23% to 50% B; 30–40 min, 50% to 80% B; 40–42 min, 80% to 100% B; 42–45 min, 100% B; 45–46 min, 100% to 0% B; 46–52 min, 0% B. The column compartment temperature was held at 40 °C and the flow rate was set to 0.700 mL/min, 1 µL injections for all sample extracts and either 1 or 5 µL for the QC samples. Peaks were monitored at 280, 320, 360 and 520 nm with a diode array detector. MS data was collected in negative ionization mode (spray voltage = 2.8 kV) with scan range set to 90–1,300 m/z. Data was visualized and analysed using Thermo FreeStyle™ 1.6 software. All compounds were identified by matching the retention time (RT) and MS/MS-MS fragmentation with the in-house database of phenolic standards and that of the literature. Since the predominant phenolics were HCA esters of different organic acids whose standards are not commercially available, the effect of LED light on the quantity of the phenolic compounds detected in this study was evaluated using the ion counts of the peak of extracted ion chromatograms (XIC).
2.4. Statistical Analysis
Peak area (ion counts) averages of XIC for the compound of interest were used for one-way ANOVA followed by Dunnett’s post hoc test for all LED light treatments and microgreens to determine the differences against control (p<0.05) using IBM SPSS® software for Windows version 25.0 (IBM corporation, Armonk, NY, USA). Contents were expressed as mean ± SD of triplicate extractions.
| 3. Results and discussion | ▴Top |
3.1. Identification of polyphenolics by LC-HRMS/MS-ESI from Brassica microgreens
A representative XIC and major phenolic peaks are shown in Figure 1. The phenolic compounds identified in eight Brassica microgreens along with their parent and fragment ions (order of decreasing intensity) and RT are listed in Table 1. A total of 46 phenolics, including phenolic acids and flavonoids, were positively or tentatively identified. Conjugated derivatives of HCA predominated the majority of phenolics identified in the microgreens, followed by free phenolic acids and flavonol glycosides (Figures 1, 2). Several studies reported on the phenolic composition in mature Brassica vegetables, and recently in microgreens of mustard, cabbage and pac choi (Sun et al., 2013; Alrifai et al., 2019). A recent study showed the phenolic acid content accounted for 79% of the mean total phenolic content in three species of microgreens, followed by flavonol glycosides (20.7%) and flavone glycosides (0.3%) (Kyriacou et al., 2019), a pattern that is similarly found in the current study. Lower contents of HCA and higher flavonol glycosides were found in three other species of microgreens (Kyriacou et al., 2020). The results in the current study agree with literature data, suggesting these groups of phytochemicals are not only specific to the Brassica microgreens, but light quality had a larger influence on their accumulation.
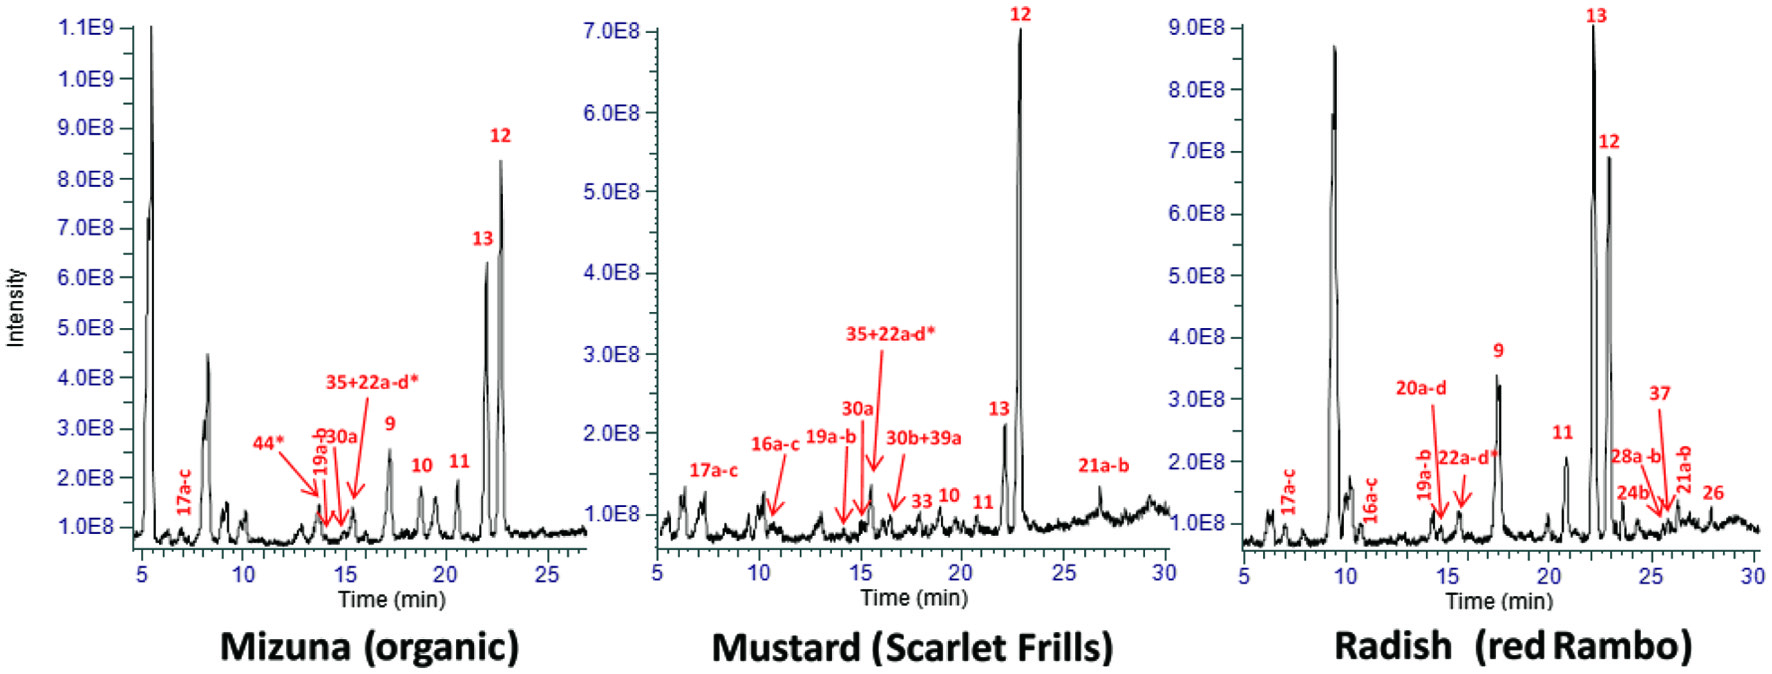 Click for large image | Figure 1. Peak area averages of the extracted ion chromatograms (XIC) of polyphenolic extracts of representative Brassica microgreens [B. rapa (mizuna), B. juncea (mustard) and R. sativus (radish)]. The detected polyphenolics are identified according to their fragmentation patterns and retention times, and their content levels are generally identified with a larger intensity. *, other non-polyphenolic compounds eluting with detected polyphenolics; quercetin (Qn); kaempferol (Km); caffeoyl malate, 9; hydroxyferuloyl malate, 10; coumaroyl malate, 11; sinapoyl malate, 12; feruloyl malate, 13; salicylic acid glucoside, 16a/b/c; dihydroxybenzoic acid glucoside, 17a/b/c; feruloyl glucoside, 19a/b; sinapoyl gentiobioside, 20a/b/c/d; disinapoyl gentiobioside, 21a/b; sinapoyl glucoside, 22a/b/c/d; Km 3-diglucoside, 24b; Km 3,7-dirhamnoside, 26; Km glucoside rhamnoside, 28a/b; Km hydroxyferuloyl diglucoside glucoside, 30a; qn feruloyl diglucoside glucoside, 30b; km sinapoyl diglucoside glucoside, 33; Km caffeoyl-diglucoside glucoside, 35; Qn dirhamnoside, 37; Qn sinapoyl diglucoside glucoside, 39a; Qn caffeoyl diglucoside glucoside, 44. |
 Click to view | Table 1. LC–HRMS/MS-ESI identification of polyphenolics in eight Brassica microgreens |
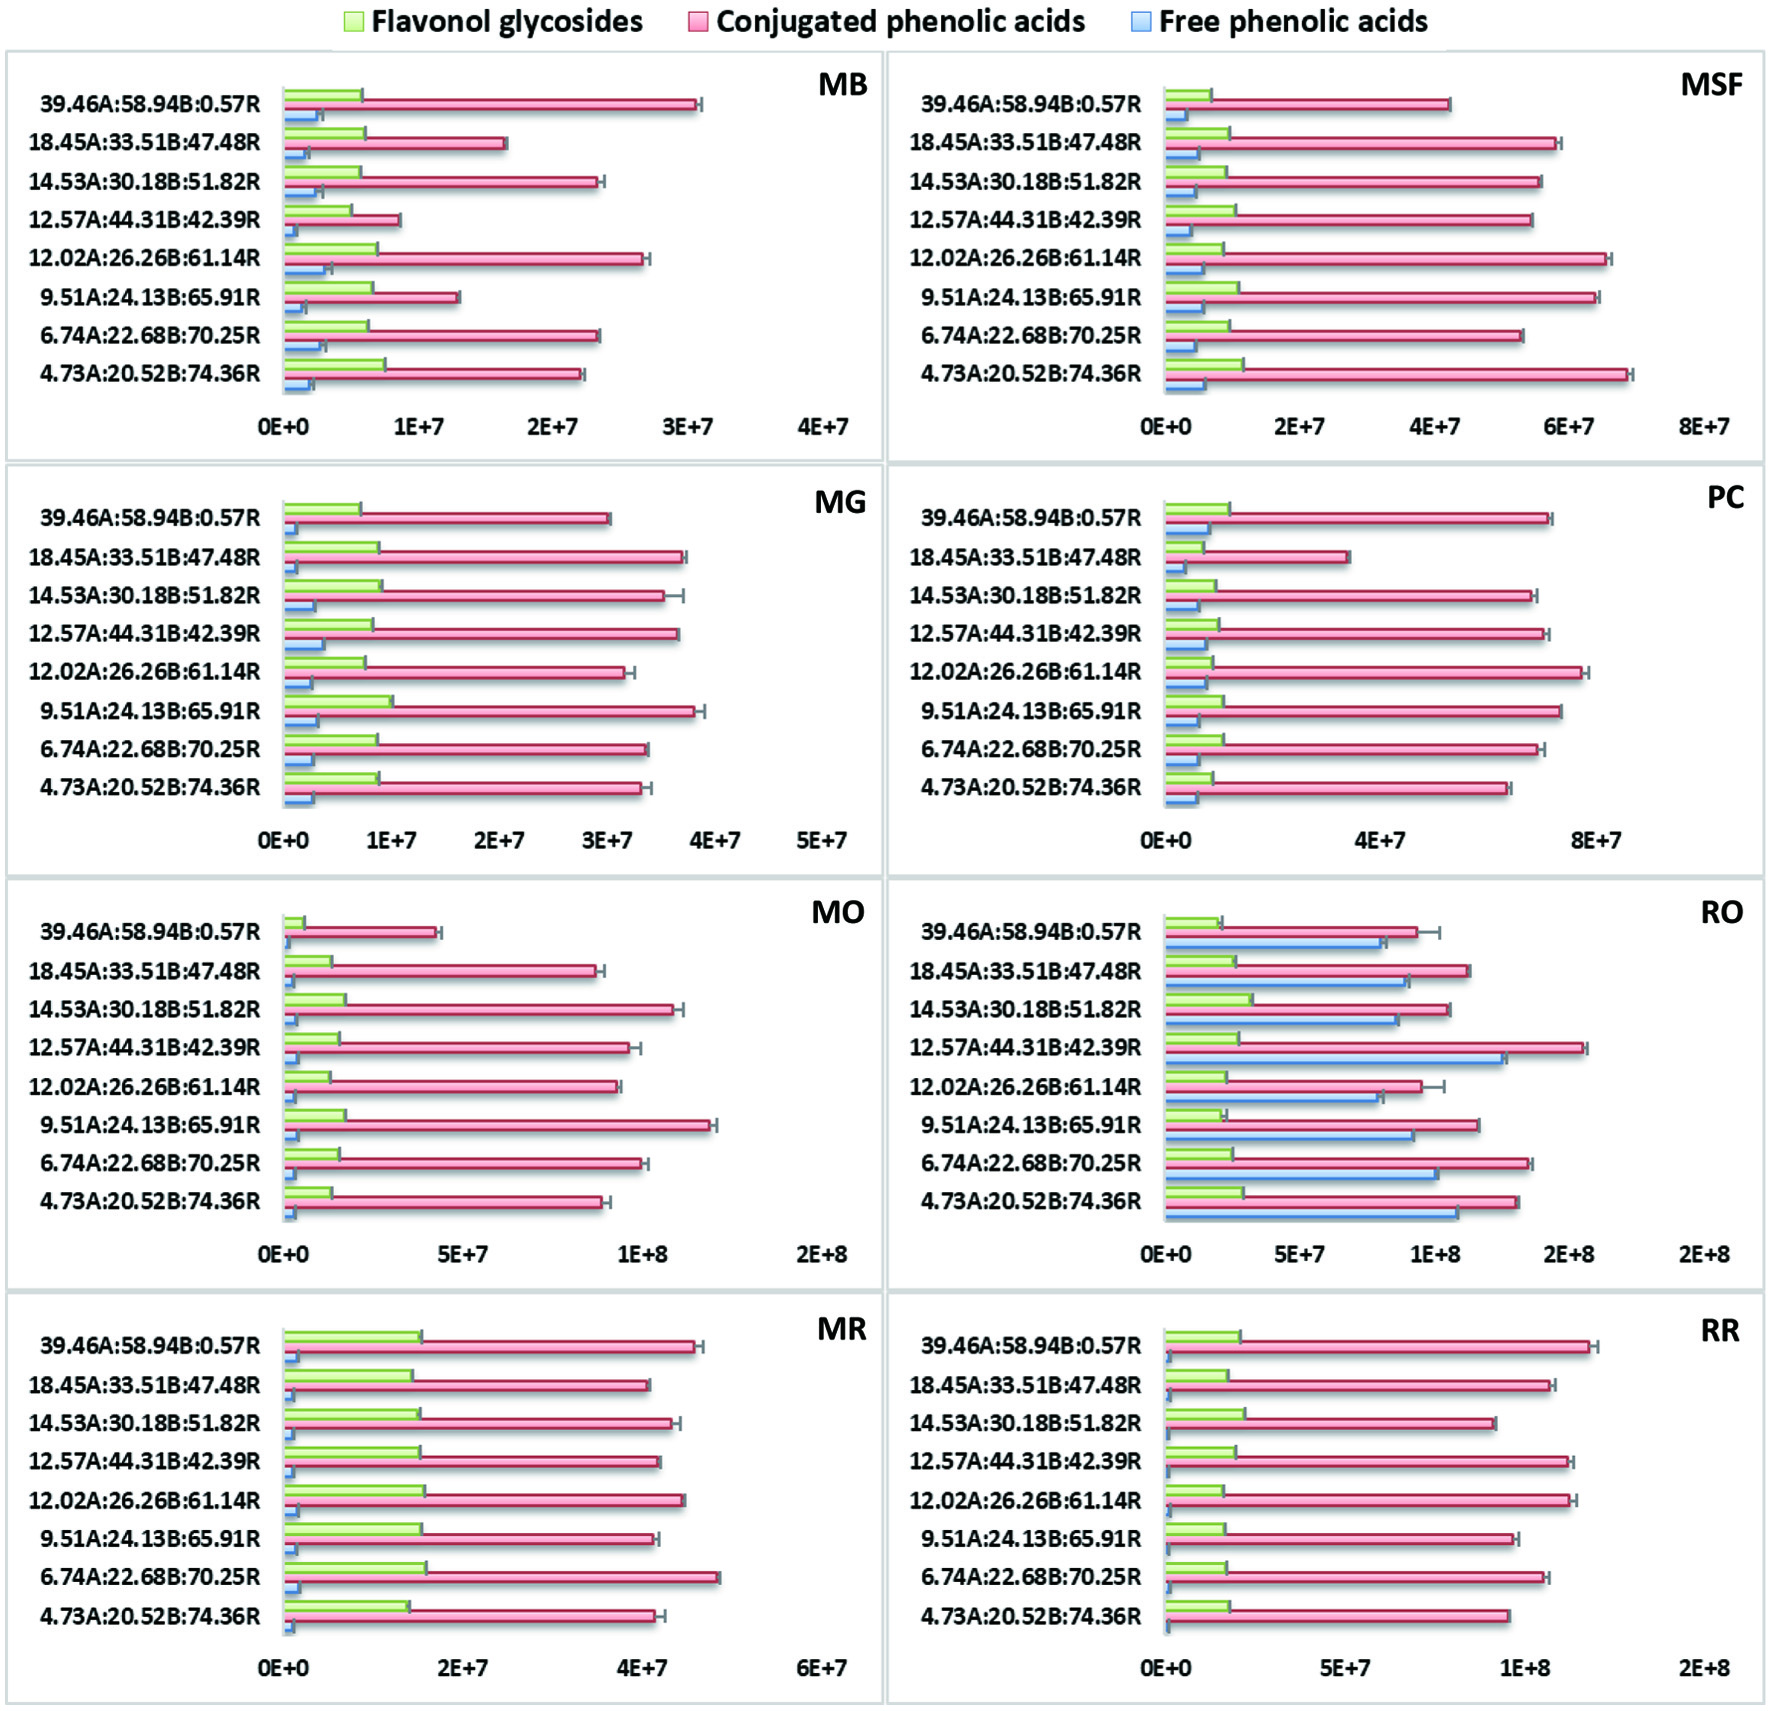 Click for large image | Figure 2. Extracted ion chromatograms (XIC) of three sub-groups of detected polyphenolics (flavonol glycosides/conjugated phenolic acids/free phenolic acids) under each treatment in Brassica microgreens. Control is 4.73A(amber):20.52B(blue):74.36R(red) and bars represent the peak area averages ± SD of three replicates per microgreen. |
3.2. Hydroxycinnamic/benzoic acids and derivatives
Compounds 1, 2 and 3 were identified as p-, m- and o-coumaric acid, respectively, with the same deprotonated molecular ion [M-H]− of m/z 163.0401 and the major fragment ion at m/z 119.0501 (Table 1). The main fragment ion of caffeic acid 6 was m/z 135.0451 (neutral loss of CO2, 44 amu, from [M-H]−) (Chen et al., 2019; Sinosaki et al., 2020). One study identified the presence of ferulic acid 5 in PC microgreens, although this was not seen in the current study which could imply that under the current combined lighting and photon flux the accumulation of 5 was inhibited (Kyriacou et al., 2020). Accumulation of 5 under blue LED (bLED) was higher compared to red LED (rLED) and white LED (wLED) in another study in B. rapa (Kim et al., 2015). Ferulic acid 5 was only found in microgreens of RR, MO and MR (Table 1). Isomers chlorogenic acid 7 and neochlorogenic acid 8, commonly found in low concentrations in Brassica species, were identified by the same deprotonated molecular ion [M-H]− of m/z 353.087 and the major fragment ion at m/z 179.0349 ([M-H]− of 6) formed by McLafferty rearrangement (Wu et al., 2009). In the present study compound 7 was found in all but MG, RR and RO, and 8 was only found in MB. In some microgreens and treatments, two overlapping peaks are seen for chlorogenic acid and its isomer (cryptochlorogenic acid) which could not be separated (Figure 1).
Peaks 9–13 in Figure 1, i.e., caffeoyl malate ([M-H]− m/z 295.0460, 9), hydroxyferuloyl malate ([M-H]− m/z 325.05651, 10), coumaroyl malate ([M-H]− m/z 279.051, 11), sinapoyl malate ([M-H]− m/z 339.0722, 12) and feruloyl malate ([M-H]− m/z 309.0616, 13) were tentatively identified according to literature data and based on their deprotonated ions and their fragments (Table 1) (Harbaum et al., 2007; Oszmiański et al., 2013; Koley et al., 2020; Oulad El Majdoub et al., 2020). These were the most dominant phenolics identified in the microgreens, and were all malate esters of caffeic (6), 5-hydroxyferulic acid, p-coumaric (1), sinapic (4) and ferulic acid (5), respectively, from the characteristic loss of malate (116 amu) (Figure 3). In Brassica, hydroxycinnamoyl esters of malic acid are synthesized by action of sinapoylglucose:malate sinapoyltransferase (SGMS), an enzyme which is capable of transferring the hydroxycinnamoyl moiety from a hydroxycinnamoyl-glucose ester to a malic acid acceptor (Sullivan, 2009). Sinapoylglucose accumulator 1 (SNG1) gene in Arabidopsis thaliana encodes the enzyme responsible for the accumulation of sinapoyl malate in seeds and leaves (Lehfeldt et al., 2000). For example, SGMS extracted from radish (Raphanus sativus) is a homolog of the Arabidopsis SNG1 gene product and can catalyze sinapoyl-, feruloyl-, caffeoyl- and coumaroyl-glucoside esters to form the corresponding malic acid esters (Sullivan, 2009). Peak ion height was generally the highest for malates, therefore the genes controlling their formation under LED should be further examined to understand the light-regulated gene activity.
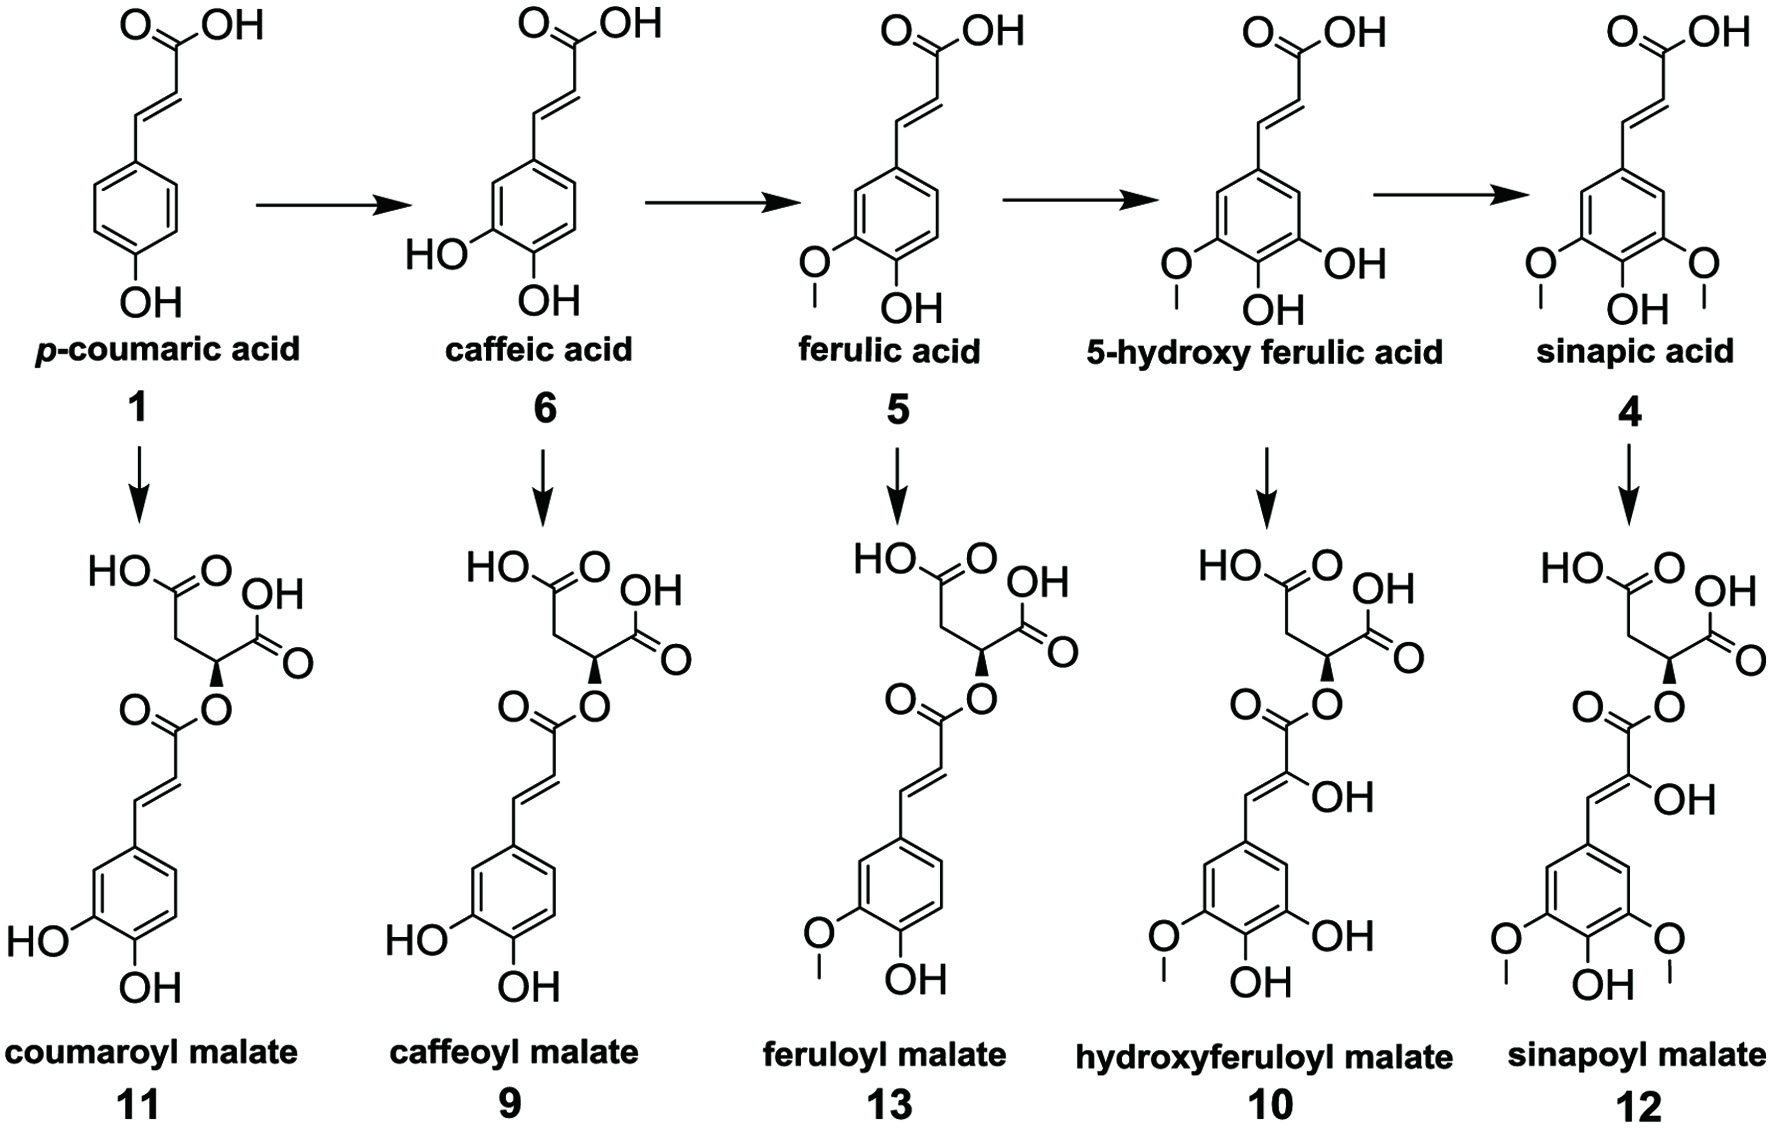 Click for large image | Figure 3. Hydroxycinnamic acids (HCA) (top) and malate esters of HCA (bottom) detected in Brassica microgreens under amber, blue and red LED. |
Several glucosides or hexosides were indeed also identified. Compound 14a/b with [M-H]− of m/z 341.088 was identified as caffeic acid glucoside with major fragment of m/z 179.0354 (6, loss of hexosyl, 162 amu) (Kramberger et al., 2020). Glucosides of hydroxyferulic acid 15, salicylic acid 16a/b/c, dihydroxybenzoic acid 17a/b/c, feruloyl 19a/b and sinapoyl 22a/b/c/d were also tentatively identified by matching with literature reports which observed the loss of a glucoside unit (162 amu) from their respective deprotonated molecular ions and the aglycone ions (Table 1) (Olsen et al., 2009; Blazics et al., 2010; Sarkar et al., 2012; Torras-Claveria et al., 2012; Oszmiański et al., 2013; Sun et al., 2013; Zhang et al., 2013; Huang et al., 2015; Truchado et al., 2015; Gómez-Caravaca et al., 2016; Liu et al., 2016; Qu et al., 2020). Salicylic acid is a modulator of plant stress response and is produced in the phenylalanine ammonia lyase/ isochorismate synthase pathway which is responsible for controlling biotic and abiotic factors (Lefevere et al., 2020).
Compound 18 with its deprotonated molecular ion [M-H]− of m/z 371.0984 was tentatively identified as 3-benzoyloxy-2-hydroxypropyl glucopyranosiduronic acid according to literature data and fragment of m/z 249.0618 corresponding to the neutral loss of benzoic acid (122 amu) (Wang et al., 2018). Compound 20a/b/c/d/e with [M-H]− of m/z 547.1671 showed major fragment of m/z 205.0513 (loss of gentiobiose, 342 amu) and m/z 223.0618 (loss of H2O from 4), and therefore was tentatively identified as sinapoyl gentiobioside (Table 1) (Lin et al., 2011; Engels et al., 2012; Oszmiański et al., 2013; Morreel et al., 2014; Qu et al., 2020). These compounds were only detected in RR microgreens in the present study. Sinapoyl gentiobioside is relatively abundant in B. oleracea and at least three of its isoforms can be identified in any Brassica species (Sousa et al., 2008; Lin et al., 2011; Shao et al., 2014; Qu et al., 2020). Compound 21a/b with [M-H]− of m/z 753.2263 was tentatively identified as disinapoyl gentiobioside according to literature data with the major fragment of m/z 529.1561 (loss of 4) (Ferreres et al., 2008; Picchi et al., 2020). Compound 23a/b/c with [M-H]− of m/z 723.2151 was tentatively identified as sinapoyl feruloyl gentiobioside in only radish (RR, RO) microgreens according to literature data on cabbage and PC and major fragments of m/z 499.1479 (loss of 4) and m/z 193.0509 (loss of gentiobiose and neutral 4) (Table 1) (Harbaum et al., 2007; Sousa et al., 2008).
3.4. Flavonols and derivatives
The MS analysis of all microgreen extracts indicated that the main flavonoids in Brassica vegetables were Qn and Km derivatives, and less of Iso, and most of them were ester-linked glycosides (O-glycosides) or O-acylglycosides (Table 1) (Cartea et al., 2010; Sun et al., 2013).
Compound 24a with deprotonated molecular ion [M-H]− of m/z 609.1470 was tentatively identified as Km 3,7-diglucoside according to literature on other Brassica vegetables, with fragments of m/z 447.0939 (loss of one glucose moiety, 162 amu) and m/z 285.0408 (Km, loss of the second glucose moiety) (Lin et al., 2011; Li et al., 2016). A lower peak area of m/z 447.0939 indicated the presence of the diglucoside moiety; thus, compound 24b was tentatively identified as Km 3-glucosyl glucoside and 24c as Qn rhamnosyl glucoside based on the observed fragment of m/z 447.0931 (loss of glucosyl moiety) and m/z 301.0354 (Qn, loss of a glucosyl moiety) (Olsen et al., 2009; Sun et al., 2013). Compound 25a/b with [M-H]− of m/z 579.136 was tentatively identified as Qn rhamnoside pentoside according to literature data and the observed fragments of m/z 447.0931 (loss of pentose, 132 amu) and m/z 301.0358 (Qn, loss of rhamnosyl unit, 146 amu) (Table 1) (Barros et al., 2011).
Compound 26 with pseudo-molecular ion [M-H]− of m/z 577.1563 was detected in radish microgreens (RR, RO) only, and was tentatively identified as Km 3,7-dirhamnoside with fragments m/z 431.0986 (neutral loss of one rhamnose, 146 amu) and m/z 285.0406 (Km, loss of second rhamnose) that indicated two rhamnose moieties in different positions on the aglycone (Harbaum et al., 2007; Negri et al., 2012). Structurally similar Km derivatives can also be found in turnip (B. rapa) and cabbage (B. oleracea) microgreens (Table 1) (Ferreres et al., 2008). Compound 27 with [M-H]− of m/z 563.1411 was tentatively identified as Km rhamnosyl pentoside according to one study based on fragmentation of [M-H]− to m/z 431.1000 (loss of pentose, 132 amu) and m/z 285.0406 (Km, loss of rhamnosyl moiety, 146 amu) (Barros et al., 2011). Deprotonated molecular ion [M-H]− of m/z 593.1513 and 933.2532 were tentatively identified as Km triglucoside rhamnoside 28a/b and Km triglucoside glucoside 29 according to literature data and major fragments of m/z 447.035 and 771.2006 indicating the loss of rhamnosyl moiety (146 amu) and glucosyl moiety (162 amu), respectively. Both compounds 28a/b and 29 also had fragment of m/z 285.0406 (Km) from the loss of the glucosyl (162 amu) and triglucosyl (648 amu) moiety, respectively (Table 1) (Gonzales et al., 2014; Onkokesung et al., 2014; Zhang et al., 2018).
Peaks 30–35 were acylglycosides of Km. Compound 30a/b with deprotonated molecular ion [M-H]− of m/z 963.2424 was tentatively identified as Km hydroxyferuloyl diglucoside glucoside/Qn feruloyl diglucoside glucoside according to the literature data and based on fragments m/z 801.1872 and 609.1472 (loss of a glucosyl unit, 162 amu) and the feruloyl ion (192 amu). Additionally, fragments m/z 284.0332 (Km, loss of diglucoside moiety, 325 amu) and m/z 300.021 (Qn) were observed (Table 1) (Li et al., 2018; Youssif et al., 2019). Compound 31a/b and 32 with deprotonated molecular ion [M-H]− of m/z 1109.3011 and m/z 947.2474 were tentatively identified as Km feruloyl trigulucoside glucoside and Km feruloyl diglucoside glucoside, respectively, based on similar fragmentation patterns, i.e., loss of the glucosyl and diglucosyl moieties, and the presence of the feruloyl and Km fragments (Schmidt et al., 2010; Li et al., 2018). Other Km derived cinnamic acid glucosides were tentatively identified as Km sinapoyl diglucoside glucoside ([M-H]− m/z 977.2584, 33), Km sinapoyl triglucoside glucoside ([M-H]− m/z 1139.3110, 34a/b) and Km caffeoyl diglucoside glucoside ([M-H]− m/z 933.2314) based on similar fragmentation to the literature data (Table 1) (Schmidt et al., 2010; Li et al., 2018).
Qn glycosides were the most abundant flavonols in the microgreen samples. Compound 36a/b with deprotonated molecular ion of [M-H]− at m/z 625.1414 was tentatively identified as Qn 3,7-diglucoside/Qn 3-diglucoside according to the literature and fragments of m/z 463.0880 (loss of glucosyl moiety, 162 amu) and m/z 301.0355 (loss of second glucosyl) (Table 1) (Lin et al., 2011; Li et al., 2016). Compound 37 with deprotonated molecular ion of [M-H]− at m/z 593.1513 was tentatively identified as Qn dirhamnoside according to one study with fragments of m/z 446.0934 (loss of first rhamnosyl unit, 146 amu) and m/z 301.0354 (Qn, loss of second rhamnosyl unit) (Barros et al., 2011). Compound 38 with deprotonated molecular ion of [M-H]− at m/z 949.248 was tentatively identified as Qn triglucoside glucoside based on literature data in mustard greens, yu choy and 15 other Brassica vegetables and fragments of m/z 787.1954 (loss of first glucosyl moiety), m/z 462.0809 (loss of diglucoside, 325 amu) and m/z 300.0278 (Qn, loss of second glucosyl) (Table 1) (Lin and Harnly, 2010).
Peaks 39–44 were Qn acylglycosides, except 43b which was a Km acylglycoside. Compound 39a/b with [M-H]− at m/z 993.2535 was tentatively identified as Qn sinapoyl diglucoside glucoside/Qn sinapoyl triglucoside based literature data and fragments of m/z 831.2026 (loss of glucosyl unit, 162 amu), m/z 300.0277 (Qn) and m/z 462.0810 (sinapoyl-glucoside) (Lin and Harnly, 2010; Gonzales et al., 2015). Compound 40a/b with [M-H]− at m/z 1155.3054 was tentatively identified as Qn 3-sinapoyltriglucoside-7-glucoside according to the literature data in Brassica microgreens of other red mustards, pac choi, kale and mizunas other studies, and observed fragments of m/z 993.2586 (loss of glucosyl unit), m/z 787.1922, m/z 462.0810 (Qn glucoside) and m/z 300.0275 (Qn, loss of glucosyl unit) (Table 1) (Llorach et al., 2003; Schmidt et al., 2010; Sun et al., 2013). Compound 41 with [M-H]− at m/z 933.2314 was tentatively identified as Qn coumaroyl diglucoside glucoside according to the literature and fragments of m/z 787.1967 (loss of coumaroyl unit, 146 amu), m/z 624.400 (loss of 162 amu, glucosyl unit) and m/z 462.0805 (loss of glucosyl) and m/z 300.0272 (Qn) (Table 1) (Schmidt et al., 2010; Koley et al., 2020). A similar pattern was observed for 42a/b which was tentatively identified as Qn hydroxyferuloyl diglucoside glucoside based on literature data and fragments m/z 787.1943 (loss of dehydrated dihydroferulic acid moiety, 192 amu), m/z 625.1415 (loss of glucosyl moiety) and the presence of Qn (m/z 300.0278) (Schmidt et al., 2010; Benayad et al. 2014). Compound 43a with pseudo-molecular ion [M-H]− of m/z 1125.2957 was tentatively identified as Qn 3-feruloyldiglucoside-7-glucoside according to literature data and fragments m/z 963.2440 (loss of glucosyl), m/z 787.1957 (subsequent loss of feruloyl group, 176 amu), m/z 463.0876 (loss of diglucoside, 324 amu) and presence of m/z 301.0355 (Qn) (Table 1) (Li et al., 2018; Yang et al., 2018). An earlier eluting isomer 43b with the same pseudo-molecular [M-H]− was tentatively identified as Km 3-hydroxyferuloyl-diglucoside-7-diglucoside according to one study with fragments of m/z 771.2006 (loss of hydroxyferuloyl glucoside, 354 amu) and the presence of Km (Lin et al., 2011). Similarly, compound 44 with deprotonated molecular ion [M-H]− m/z 949.2274 was tentatively identified as Qn caffeoyl diglucoside glucoside according to the literature and by the losses of the glucosyl, diglucoside and caffeoyl moieties from [M-H]− to produce fragments of m/z 787.1959, 625.1420, 462.0811 and 300.0278 (Table 1) (Schmidt et al., 2010; Chen et al., 2019).
Compound 45 with deprotonated molecular ion of [M-H]− at m/z 623.1624 was tentatively identified as Iso-glucoside rhamnoside according to previous reports in Brassica vegetables with fragments of m/z 477.1034 (loss of rhamnosyl, 146 amu) and m/z 315.0512 (Iso, loss of glucosyl, 162 amu) (Table 1) (Arimboor and Arumughan 2012; Sun et al., 2013; Chen et al., 2015). Compound 46 of [M-H]− at m/z 639.157 was identified as Iso-3,7-diglucoside according to literature data and fragments m/z 477.0142 (loss of glucosyl moiety) and m/z 315.0514 (Iso, loss of second glucosyl) and (Table 1) (Lin et al., 2011; Li et al., 2016). One report identified the 3- and 7- monoglucosides of Iso that is common to Brassica vegetables; however, only trace amounts were observed in our RR and RO microgreens (Sun et al., 2013).
3.5. Light effects on individual phenolic components in the microgreens
The effects of seven different combined amber, blue and red LED ratios (%) on individual phenolic compounds in the microgreens were quantitatively analysed based on the ion counts of major peaks of the XIC of different microgreen samples grown under LED, and were compared to those under the basal (control) treatments (Table 2). Based on peak areas (ion counts), free phenolic acid contents in the microgreen samples were low (except in RO); most phenolic acids were present as derivatives or conjugated with other compounds (i.e. malates, glycosides). Phenolic acid glycosides predominated the pool of phenolics in the microgreens (except in RO). Flavonoid contents in the studied microgreens had significantly lower ion counts compared to the phenolic acids (Figure 2). The current study identified 23 flavonoids and their conjugates; the majority were various Km and Qn glycosides or acylglycosides and a small number of Iso glycosides (Table 1). Considering the low peak area data detected for free phenolic acids in addition to their very low abundance in Brassica, discussion will focus on compounds with peak ion counts ≥1.0e8 and the effects of the combined LED light on their accumulation as compared with control (%) (Table 2). Data on other phenolic compounds and their changes from control are listed in Table S1. Generally, the highest ion counts (≥1.0e8) was observed for all HCA malates 9, 10, 11, 12, 13, sinapoyl glucoside 22a/b/c/d (MB only), feruloyl glucoside 19a/b (RO only) and Qn rhamnoside glucoside 24c (RO only).
Click to view | Table 2. Effect of LED treatments on the quantity of major phenolic compounds (% changes) in Brassica microgreens. |
In B. juncea microgreens (MB, MG and MSF) the predominate phenolics were malic acid esters of HCA with the highest peak intensity (ion counts). This agrees with literature reports for B. juncea which observed the predominating HCA to be the malate derivatives of sinapic, ferulic, hydroxyferulic and caffeic acids (Harbaum et al., 2008; Cartea et al., 2010). There was a significant decrease in 9, 10, 12 and 13 in MB under most treatments, except under 12.02A:26.26B:61.14R resulting in their increase by 202%, 145%, 36% and 33%, respectively (Table 2). In MB, sinapoyl glucoside 22a/b/c/d was variably affected under the combined lighting treatments and was generally significantly decreased by 29–69%. Contrasting responses under the lighting for MG were observed compared to MB, i.e., 9, 10, 11, 12 and 13 were overall significantly increased by 9.8–61.4%, 3.7–27.8%, 3.8–45.8%, 14–22.2% and 23.3%, respectively, although 9 and 11 were decreased under 6.74A:22.68B:70.25R by 11.1% and 9.8%, respectively (Table 2). Similarly, cinnamoyl malates 9, 10, 11, 12 and 13 in MSF were also significantly increased under most light treatments by 8.9–38.3%, 5.7–46.4%, 6.3–26.9%, 4.7–17.4% and 10.8–24.5%, respectively, except for 10 and 13 under 14.53A:30.18B:51.82R and 9.51A:24.13B:65.91R (Table 2). Arabidopsis and other Brassica species accumulate sinapoyl malate in their leaves presumably as a protective measure against high energy UV radiation (Jin et al., 2000; Sullivan et al., 2021). This group of malates detected in B. juncea microgreens may have been accumulated under most combined lighting regimes for similar reasons, or even under increasing blue light which is shown to be a source of high energy radiation in Brassica vegetables resulting in higher overall contents (Li et al., 2013; Kopsell et al., 2015; Vaštakaitė et al., 2015; Zheng et al., 2018; Li et al., 2019; Ying et al., 2020).
Among the B. rapa microgreens, the five cinnamoyl malates (9–13) in MO and PC were generally increased more significantly compared to MR. Under most treatments, 9, 10, 11, 12 and 13 in MO were significantly increased by 9–34.2%, 10.8–42%, 7.2–25.8%, 15.1–41.9% and 7.1–21.3%, respectively, except when treated under 39.46A:58.94B:0.57R leading to the significant decrease of 47.1–60.1% for these malates. Among the five, 11 and 13 also decreased under 12.02A:26.26B:61.14R and 18.45A:33.51B:47.48R by 8.9% and 11.2%, respectively (Table 2). In PC, a similar response was observed for these five cinnamoyl malates significantly increasing under most lighting except when under 18.45A:33.51B:47.48R. Our findings agree with one study which also identified malate esters of HCA to predominate the pool of phenolics in several PC varieties (Harbaum et al., 2007). In contrast to MO and PC, 9, 10, 11, 12 and 13 in MR were significantly decreased under most treatments by 17.2–20.8%, 8.3–28.2%, 3.3–20.5%, 3.9–39.1% and 2.1–37.4% (Table 2). Only 9 was significantly increased in MR by 4.7%.
Sinapic acid esters (e.g., sinapoyl malate and sinapoyl glucose) are important UV protectants in Brassica, and the genes involved in their biosynthesis in Arabidopsis are well documented (Fraser et al., 2007; Li et al., 2010; Shuab et al., 2016). The pathway for sinapoyl malate during biosynthesis in Brassica is well characterized biochemically and Arabidopsis genes encoding the enzymes upstream and downstream of UDP-glucosyltransferase (UGT) have been identified (Lim et al., 2001; Shuab et al., 2016). The precursor of sinapoyl malate is the glucose ester, thus modulation of the UGT enzyme involved in its formation may provide a better understanding for the link between sinapoyl malate and many other wavelengths under visible and UV light (Lim et al., 2001).
The R. sativus microgreens RO and RR differed in their response under the LED lightings in the five cinnamoyl malates 9–13. In RO, 9, 10, 11, 12 and 13 were significantly decreased under the lighting by 7.8–27.3%, 6.4–25%, 21.9–30.2%, 9.3–30.4% and 15.8–31.7%, respectively, except under 12.57A:44.31B:42.39R which showed significant increase by 15.5%, 44.4%, 27.2%, 29.9% and 12.9%, respectively (Table 2). In RR, on the other hand, 9, 10, 11, 12 and 13, were overall significantly increased under most treatments by 5.6–30.1%, 10.9–71.2%, 3.5–64.6%, 11.7–19.5% and 21.3–31%, respectively, and only 9 and 11 were significantly decreased under 14.53A:30.18B:51.82R by 4.4% and 5.1%, respectively (Table 2). Compound 19a/b in RO was also generally significantly increased by 3–60%. Irrespective of the differences in the response under light in both radish microgreens, light-grown radish seedlings had higher activity of L-malate sinapoyltransferase, the enzyme catalyzing the transformation of sinapoyl glucose to sinapoyl malate, and low 1-(hydroxycinnamoyl)glucose-hydroxylcinnamoyl-transferase activities (Dahlbender and Strack 1986; Gräwe et al., 1992; Gutiérrez and Perez 2004). Further investigation into the genes controlling phenylpropanoid pathway enzymes and their response under LED would provide a more logical understanding of individual synthesis and opportunities for maximizing their content in microgreens.
| 4. Conclusion | ▴Top |
Previously, we reported that the overall effect of various LED treatments of combined amber, red and blue lights on total phenolic content and antioxidant activities of the eight Brassica microgreens were highly species-dependent; some had high to moderately positive correlation with the LED dose, i.e., the increasing ratio of amber LED to blue and red LED, but some were not sensitive to the lighting (Alrifai et al., 2020). In the present study we focused on the profile and identification of individual phenolic compounds in these microgreens grown under the same LED lightings. By using LC-HRMS/MS-ESI, a total of 46 phenolics, including phenolic acids and flavonoids, were positively or tentatively identified. HCA derivatives were the predominant majority of the phenolics identified in the microgreens, followed by free phenolic acids and flavonol glycosides/acylglycosides. The overwhelming majority of the HCA derivatives were malate esters. In addition to species-specific responses, light quality played a large role in the profile and quantity of the phenolic compounds detected. Under combined red, blue and amber LED, the highest peak intensity by ion counts were malate esters of HCA observed in R. sativus microgreens, followed by B. juncea and B. rapa. HCA malates 9, 10, 12 and 13 in MB and 9–13 in MR and RO were decreased under most treatments, whereas all the five compounds (9–13) were overall increased under combined lighting in RR, MG, MO, PC, MSF. Additionally in MB, 9 and 10 were remarkably increased by 145% and 202% from the control, respectively, when grown under 12.02A:26.26B:61.14R.
Results of the present study demonstrated that amber LED in combination with blue and red lights contributed to the altered phenolic profile and increase and/or decrease in quantity of certain phenolic compounds, particularly the HCA malates. The effect was also species-specific among the eight Brassica microgreens tested, suggesting that developing microgreens with high amount of certain phenolic compounds using the LED technology may be multi-faceted. Also, the Brassica vegetables may contain other important bioactive phytochemicals such as carotenoids and glucosinolates, which may also contribute to the overall antioxidant or other health beneficial activities. Future studies should therefore investigate on the collective effect of LED lights on all phytochemical components and the molecular mechanisms modulating the synthesis of these bioactives. Since LED are an emerging modern technology for controlled environment agriculture, further investigation on this sub-group of vegetables under certain wavelengths and intensities will allow for production of highly nutritious microgreen vegetables. The literature is still scarce on studies investigating the underlying gene expression of the enzymes in biosynthetic pathways controlling various syntheses, and only a few to date have been studied in microgreens. Genes modulating phenylpropanoid pathway enzymes under LED, for example, would provide a logical understanding of individual synthesis response and opportunities for optimizing the nutritional and antioxidant value in microgreens.
| Supplementary material | ▴Top |
Acknowledgments
This study was supported by the A-base funds of Agriculture & Agri-Food Canada (AAFC). Project #J-001328.001.04 and #J-002228.001.07.
Conflict of interest
The authors declare no competing financial interest.
| References | ▴Top |