| Journal of Food Bioactives, ISSN 2637-8752 print, 2637-8779 online |
| Journal website www.isnff-jfb.com |
Original Research
Volume 11, September 2020, pages 95-109
Amber, red and blue LEDs modulate phenolic contents and antioxidant activities in eight Cruciferous microgreens
Oday Alrifaia, b, Xiuming Haoc, Ronghua Liua, Zhanhui Lua, Massimo F. Marconeb, Rong Tsaoa, *
aGuelph Research & Development Center, Agriculture and Agri-Food Canada, 93 Stone Road West, Guelph, Ontario, Canada, N1G 5C9
bDepartment of Food Science, Ontario Agricultural College, University of Guelph, Guelph, Ontario, Canada, N1G 2W1
cHarrow Research & Development Center, Agriculture and Agri-Food Canada, 2585 County Road 20, Harrow, Ontario, Canada, N0R 1G0
*Corresponding author: Rong Tsao, Guelph Research & Development Center, Agriculture and Agri-Food Canada, 93 Stone Road West, Guelph, Ontario N1G 5C9, Canada. E-mail: rong.cao@canada.ca
DOI: 10.31665/JFB.2020.11241
Received: September 19, 2020
Revised received & accepted: September 26, 2020
| Abstract | ▴Top |
LEDs are applied in controlled environments to produce high-quality microgreens of various nutritional benefit. We investigate different ratios of amber, blue and red LEDs on the synthesis of antioxidant phytochemicals in 8 species of the Brassica genus of microgreens. Microgreens were grown under 8 different LED ratios using combined amber, blue and red ranging from 4.73–58.94%, 20.52–58.94% and 74.36–0.57%, respectively. Results indicated that the effect of the combined lighting on antioxidant activity, total phenolic contents (TPC) accumulation, or its sub-groups total flavonoid contents (TFC) and total anthocyanin contents (TAC), were species-dependent. With increasing amber and blue and concurrently decreasing red lighting, overall positive correlations were observed for TPC, TFC and antioxidant activities (DPPH and FRAP), and overall negative correlations for TAC and ORAC (p < 0.05). Current findings suggest the microgreens can be clustered into 3 groups based on phenolic contents and sensitivity to the lighting: (i) high blue and amber dose-dependence producing high total phenolics and flavonoids content and DPPH antioxidant activity in radish, red Rambo microgreens; (ii) moderate to high sensitivity to overall lighting but no clear dose-dependence to the light in mustards Barbarossa and red kingdom; and (iii) mizunas, pac choi and other microgreens with various responses to lighting.
Keywords: Amber light; Antioxidants; Light-emitting diodes; Microgreens; Phytochemicals; Secondary metabolites
| 1. Introduction | ▴Top |
Plant secondary metabolites play significant roles in plants’ survival from biotic or abiotic stresses. The antioxidant capability of such metabolites are also believed to benefit human health when consumed (Hasan et al., 2017). Recently, microgreens have become a unique sub-class of high-value fresh baby green vegetables that are readily harvested in 12–14 days. Microgreens are 1–3 inches by length and include the central stem, cotyledons and a pair of true leaves when harvested. Several studies have reported higher contents of bioactive compounds in the cotyledons compared to mature leaf counterparts, and because of their health promoting properties they are considered ‘functional foods’ (Kyriacou et al., 2019a; Xiao et al., 2012). Microgreens can exist as vegetables, herbaceous plants, aromatic herbs, grains and other wild species (de la Fuente et al., 2019).
Red and blue light wavelengths are important components of the light spectrum for plant growth and photosynthesis (He et al., 2017). Light-emitting diodes (LEDs) emitting red and blue wavelengths have been a preferred energy-efficient source of lighting over conventional high-pressure sodium (HPS) and fluorescent lighting because of their longevity, ease of use and high luminous efficiency. It is beneficial to tailor the light spectrum to target the action of plant photoreceptors as a result of the variability in plant responses to light. In plants, blue light is detected by cryptochromes, phototropins, chlorophyll and carotenoids, and red light by phytochromes and chlorophyll (Kong and Okajima, 2016). Light is also a stressor which can create radicals in the plant system thus modulating the antioxidant defense systems for protection. Broad spectrum light can sometimes result in counter-interactions within the plant and can exhibit undesirable traits such as stem elongation and reduction in synthesis of important antioxidant compounds like phenolics and carotenoids (Samuolienė et al., 2013). Research is generally limited to uneconomical and less ‘photosynthetically effective’ spectral components like yellow, orange, and green light, and others outside the photosynthetic active range such as UV light (Kamal et al., 2019). Literature data is also inconsistent on the effects of these spectral outputs on similar families of vegetables possibly due to the accessibility and cost of such custom-made LED chips.
Although there are knowledge gaps in the yellow-orange light range, most existing studies examine ‘green light’ which is defined as a broader range of light between 500–600 nm. Contradicting results have been reported on the effects of light on plant growth and development. Some reported overall lower yield caused by increased ‘green light’, and others beneficial responses on yield and morphology in microgreen varieties of the Brassica genus (Kamal et al., 2019). Green LEDs in the range of 525–575 nm promoted Boston leaf lettuce growth while green-yellow LEDs (575–625 nm) suppressed their growth (Kong and Okajima, 2016). The effect by yellow (580–600 nm) light might have inhibited chlorophyll formation which decreases overall photosynthesis (Dougher and Bugbee, 2001). Although there is a limited number of studies, the conclusions point to the importance of light spectrum in the narrow range between 560–620 nm. The differences between wavelengths in this range and the response by the plant with reproducible cut-off values should be further examined. Supplementary flashing amber (596 nm) LED light on 7 day old green leafy radish sprouts was found to increase monosaccharide content and modulate sugar and carbohydrate metabolism. The same study also showed 30% increase in TPC and 1.5 times higher 2,2-diphenyl-1-picrylhydrazyl (DPPH) radical scavenging activity as a result of flashing amber light (Viršilė et al., 2009). Supplementary pulsed yellow (590 nm) LEDs to basal HPS light increased ascorbic acid (AA) and antioxidant activity in basil microgreens (Vaštakaitė et al., 2018). Anthocyanin synthesis was also enhanced by LEDs under yellow light (570–590 nm). These rather conflicting results in phytochemical synthesis as affected by the quality LEDs, especially those in the yellow to amber range, warrant further studies.
Since phenolics are known for their strong antioxidant activities in vitro, the objective of this study was to evaluate the role of supplementary amber (590 nm) LEDs to basal red (660 nm) and blue (455 nm) LED regimes in different ratios on the synthesis of phenolics. Special attention is given to the effect of different spectral ratios on different Brassica microgreens. The amount of red light was reduced accordingly to increasing amber light to maintain the same light intensity (photosynthetic active range, PAR) so the effects of spectral quality are not confounded by light quantity (Snowden et al., 2016). The proportion of blue light was increased with amber light due to the relative low efficiency of amber LED chips. Many reports show positive enhancement on microgreen growth and photosynthesis under blue and the combination of red and blue thus we believe this is the first step towards understanding the response of these microgreens under amber LEDs and their effects on bioactive synthesis (Kamal et al., 2019; Kyriacou et al., 2019b; Vaštakaitė-Kairienė et al., 2015; Ying et al., 2020).
| 2. Materials and methods | ▴Top |
2.1. Chemical reagents and standards
Cyanidin-3-glucoside (C3G) standard was purchased from Indofine (Bell Mead, NJ, USA). AA, fluorescein, catechin, gallic acid (GA), 2,4,6-Tri(2-pyridyl)-s-triazine (TPTZ), 2,2′-azobis-(2-methylpropionamidine) dihydrochloride (AAPH), Folin-Ciocalteu (FC) phenol reagent, Trolox, aluminum chloride hexahydrate (AlCl3·6H2O), and DPPH were purchased from Sigma (St. Louis, MO, USA). Ferric chloride hexahydrate (FeCl3·6H2O), sodium acetate, sodium hydroxide (NaOH), sodium nitrate (NaNO2), sodium carbonate (Na2CO3), sodium phosphate monobasic (NaH2PO3), sodium phosphate dibasic (Na2HPO3), potassium chloride, and HPLC grade solvents, methanol (MeOH), glacial acetic acid, formic acid, and hydrochloric acid (HCl) were purchased from Caledon Laboratories (Georgetown, ON, Canada). All chemical reagents used were of analytical grade.
2.2. Lighting treatments in the chambers
Each growth chamber (PGW40; Conviron, Winnipeg, MB, Canada) was divided by a light impervious wooden barrier coated with highly reflective material, providing 1.93 m2 of growing space. The barrier contained a small gap at the top and bottom allowing adequate air flow. The lighting system in each chamber half consisted of custom-made Ceres CL LED fixtures (Yunustech, Brampton, ON, Canada) with two 30V/200W open frame power supplies on each side, and a dimmer. Each growth area consisted of various ratios of red (660 nm), blue (455 nm) and amber (590 nm) LEDs shown in the spectral distribution in Figure 1. To ensure there was no light contamination between the treatments, measurements were taken in the dark half side while the other half of the chamber was illuminated, and values were determined on a scale of 0–1 implying no light leakage ‘0’ and full lighting ‘1’. Values were taken using an LI-COR ideal quantum sensor (LI-190R quantum sensor, LI-COR Biosciences, Lincoln, NE, USA) at 12 different locations within each treatment and overall photosynthetic photon flux (PPF) of the treatments were measured (Figure 2). Light measurements during growth were taken four inches above the plants. Because amber LEDs are inefficient and red LED semi-conductors emit a small proportion of light in the amber region, definite statements regarding the effects of any individual light cannot be made. Interpretation of the data will be based on overall lighting consisting of red, amber and blue components and comparing their ratios between the treatments to see which benefitted the accumulation of phytochemicals overall.
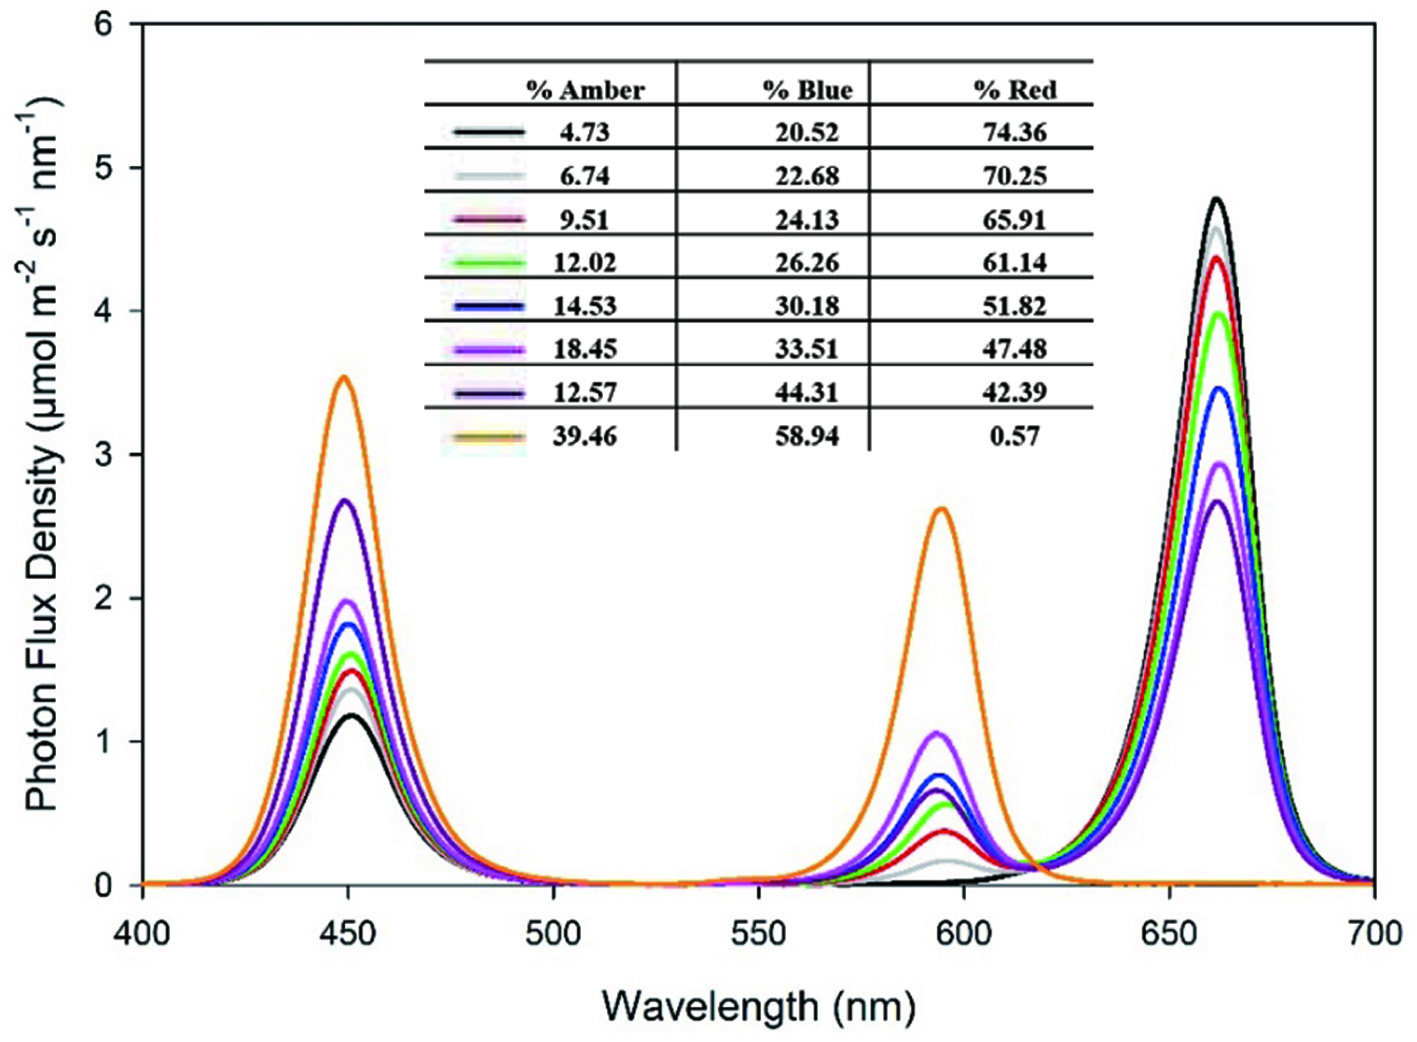 Click for large image | Figure 1. Relative spectral distribution of the amber (590 nm), red (660 nm) and blue (455 nm) LEDs used in the lighting equipment. |
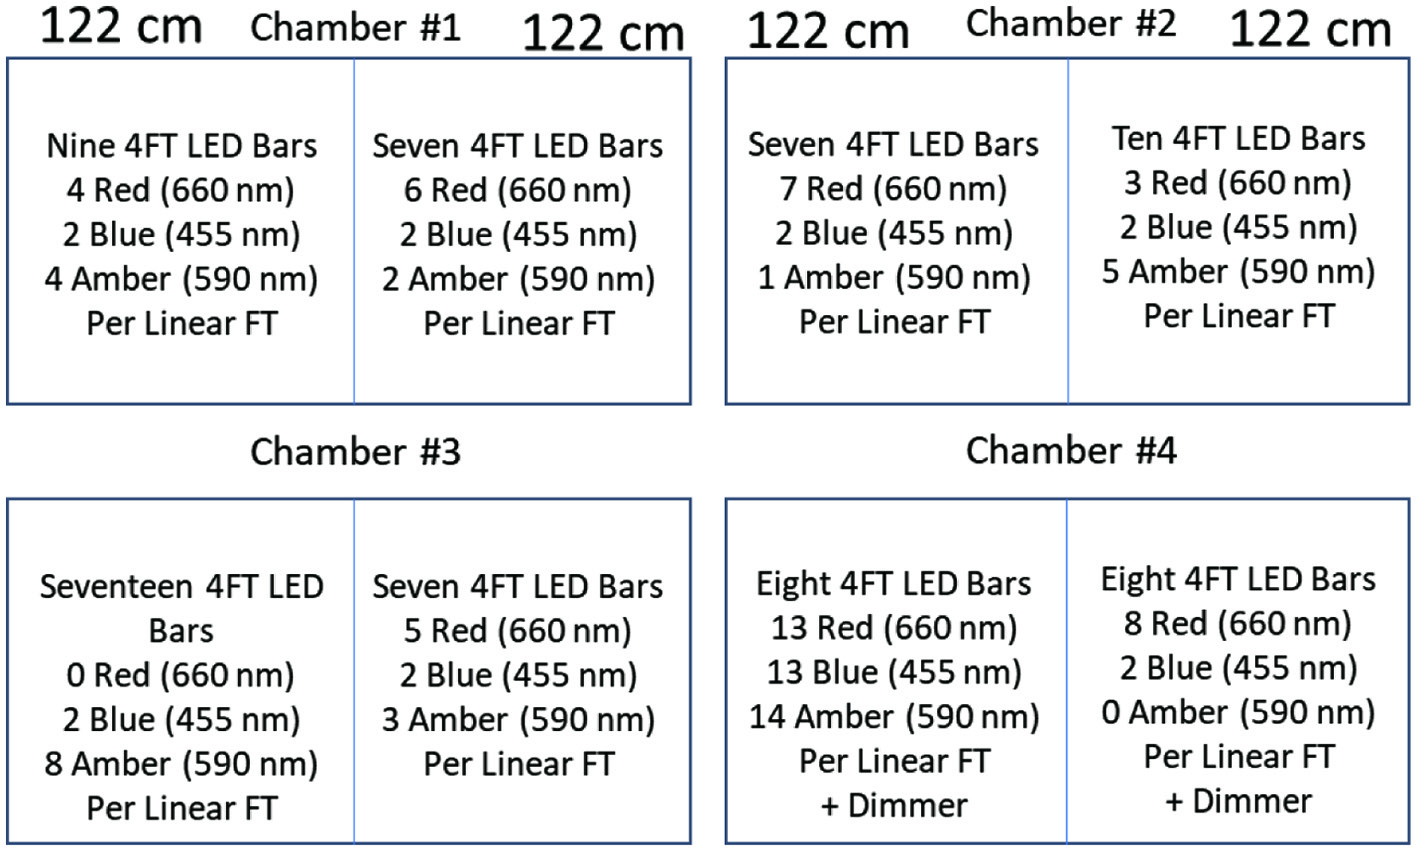 Click for large image | Figure 2. Schematic of the chamber design for microgreens production. Each growth chamber was divided by a light impervious wooden barrier coated with highly reflective material, providing 1.93 m2 of growing space. The lighting system in each chamber half consisted of custom-made Ceres CL LED fixtures with two 30V/200W open frame power supplies on each side, a dimmer and each growth area consisting of various ratios of red (660 nm), blue (455 nm) and amber (590 nm) LEDs. |
2.3. Plant growth materials and parameters
Eight varieties of Brassica microgreens: mizunas Brassica rapa var. Japonica [organic (MO) and red kingdom (MR)]; pac choi Brassica rapa var. Chinensis (PC); radishes Raphanus sativus [red Rambo (RR) and red Rambo organic (RO)]; and mustards Brassica juncea [Scarlet Frills (MS), Barbarossa (MB) and Garnet Giant (MG)] were grown at the Harrow Research & Development Centre, Agriculture and Agri-Food Canada (Harrow, Ontario, Canada). Seeds of microgreens were purchased from Johnny’s Selected Seeds (Winslow, ME, USA). Approximately 4–5 seeds were sown in each pot of the plastic trays (1 × 1 × 2 cm) and filled with 100% Canadian Sphagnum Peat Moss (pH 6–6.2, 1,400 ms/M, and average amounts of nutrients (ppm) N, 110; P, 32; K, 170; and other microelements Ca, Mg, Fe, S, Mn, ASB Greenworld Ltd., Mount Elgin, ON, Canada) for germination. Trays with seeds were submerged in a tray containing fertilizer and were subsequently placed on racks in a germinating room (24 °C; 90% relative humidity (RH); 16 h photoperiod). Seed pots were water sprayed, irrigated and rotated as needed. Durations for seed germination and growth duration in the chambers for each microgreen is listed in Table 1. Upon first signs of seed germination, the plantlets were moved to the chambers and were grown until harvest for 13–14 day under a combined total of eight treatments (2 treatments/chamber; 16 °C; 70% RH; 16 h photoperiod). Microgreens were harvested at their base with true leaves and cotyledons. Immediately the microgreens were placed in a −80 °C freezer overnight prior to freeze-drying. Frozen microgreens were freeze-dried for approximately 2 d. The samples were then ground to a fine powder using a stainless-steel coffee grinder (Black & Decker SmartGrind, model CBG100SC) for approximately 45 seconds and stored in sealed bags at −80 °C until analysis. All microgreens were grown in triplicate over two separate and successive trials for a total of six biological repeats.
 Click to view | Table 1. Durations for germination in growth chambers for each microgreen |
2.4. Sample extraction
Phenolic compounds were extracted from freeze-dried powder of microgreens using a slightly modified protocol (de la Fuente et al., 2019; Xiao et al., 2019). Briefly, freeze-dried powder (200 mg) was weighed and transferred into a 15 mL tube containing 4 mL of 1% formic acid (v/v) in 80% MeOH. Tubes were ultrasonicated in a warm water bath for 15 minutes prior to shaking on a rotary shaker for 4 h at 400 rpm at room temperature (Scientific Industries Inc. USA), and then centrifuged at 1,600 g for 5 min before the supernatant of each sample was transferred to a clean 15 mL tube. The suspended pellet was re-extracted with the same solvent twice more, once with 2 mL for 2 h and another with 1 mL for 1 h with centrifugation at the end of each step. The supernatants of each sample were pooled and stored at −20°C until analysis. Extractions were carried out in triplicate for each sample for a total of 6 biological repeats per variety.
2.5. Total phenolic, flavonoid and anthocyanin content analysis
2.5.1. Total phenolic content
TPC was measured according to a previously reported method using the FC assay (Wang et al., 2011). A 25 μL aliquot of sample extract or GA standard solutions (31.25–500 μg/mL) or 80% MeOH containing 1% formic acid (blank control), were added together with 125 μL of 10× diluted FC reagent (0.2 M) into the wells of a 96-well microplate. Following 10 min incubation at room temperature, 125 μL of 7.5% Na2CO3 was added into the wells. The plate was read after 30 min at 765 nm using a UV/vis Biotek Powerwave XS2 microplate reader (Bio-tek Instruments Inc., Winooski, VT, USA). The TPC was expressed in milligrams of GA equivalents per gram of dry weight (DW) (mg GAE/g DW). All samples were tested in triplicate.
2.5.2. Total flavonoid content
Total flavonoids content (TFC) was measured using a slightly modified version of a previously reported method (Zhishen et al., 1999). A 25 μL aliquot of sample or catechin standard solutions (15.6–500 µg/mL) was mixed with 110 μL of a 0.066 M NaNO2 solution in wells of a 96-well plate. After 5 min, 15 μL of 0.75 M AlCl3·6H2O was added and allowed to react for 5 min at room temperature. The reaction was neutralized by adding 100 μL of 0.5 M NaOH. Absorbance was read at 510 nm against a blank solution consisting of the extraction solvent (80% MeOH with 1% formic acid). The same microplate reader was used. TFC was expressed as milligrams of catechin equivalents per gram dry weight of sample (mg CE/g DW) (r2 = 0.99). All samples were tested in triplicate.
2.5.3. Total anthocyanin content
Total anthocyanins content (TAC) was measured using a slightly modified pH differential method (Li et al., 2012). Briefly, 25 µL aliquots of sample extract or 80% MeOH containing 1% formic acid (blank control) or C3G standard solutions (25–400 µg/mL) were added in duplicates to the appropriate wells (one set of samples/standards in pH 1.0 and 4.5 buffers, respectively). The total absorbance (A) was obtained using the same microplate reader as stated above, and was calculated as follows:
TAC was determined in triplicate by absorbance taken at 535 nm and 700 nm at both pH 1.0 and 4.5 and is expressed as milligrams of C3G equivalents per gram of dry weight (mg C3GE/g DW).
2.6. Antioxidant activity assays
2.6.1. DPPH assay
The antiradical activity was determined based on a slightly modified version of a previously reported method (Li et al., 2011). In a 96-well microplate, 225 µL MeOH was added to blank wells and 25 µL 80% MeOH containing 1% formic acid in control wells followed by 200 µL DPPH (except in blank wells). Additionally, 25 µL aliquots of sample extracts or Trolox standard solutions (62.5–1,000 µM) were added in triplicate followed by 200 µL DPPH (350 µM). The plate was incubated for 6 h at room temperature before absorbance was measured at 517 nm. The samples were measured in triplicate and results were expressed as µmol Trolox equivalents (TE)/g DW.
2.6.2. FRAP assay
Ferric reducing antioxidant power (FRAP) assay was conducted using a slightly modified protocol reported by Li et al. (2011). Briefly, 10 μL of a sample extract was mixed with 300 μL of the ferric-TPTZ reagent (prepared by mixing 300 mM acetate buffer, pH 3.6, 10 mM TPTZ in 40 mM HCl and 20 mM FeCl3·6H2O at a ratio of 10:1:1 (v/v/v)) in wells of a microplate. The plate was incubated at room temperature for 2 h. Absorbances were taken at 593 nm. The antioxidant values were expressed as μmol AA equivalents/g DW) extrapolated from a linear standard curve (62.5–1,000 μM AAE).
2.6.3. ORAC assay
The oxygen radical absorbance capacity (ORAC) assay followed a protocol with slight modifications (Hu et al., 2012). A 25 µL aliquot of blank phosphate buffer, Trolox (6.25–100 µM) standard, or sample extracts were added in triplicate to a 96-well microplate followed by 150 µL (8.68 × 10⁻⁵ mM) fluorescein solution. Following incubation at 37 °C for 30 min, 25 µL of AAPH (153 mM) was added to initiate reactions. Fluorescence was measured every min in an automated spectrofluorometer PLX 800 (BioTek Instruments Inc., Winooski, CT, USA) with a dual scanning microplate reader for 120 min under excitation wavelength of 485 nm and emission wavelength of 520 nm. Results were expressed as µmol TE/g DW.
2.7. Statistical analysis
TPC, TFC, TAC, DPPH, FRAP and ORAC were expressed as mean ± SD of 6 biological replicates and statistical significance was set at p < 0.05. One-way ANOVA followed by Tukey’s HSD test was used for all the factors to determine the differences between groups (p < 0.05) using IBM SPSS® software for Windows version 25.0 (IBM corporation, Armonk, NY, USA) and Dunnett’s test to determine any significant effects compared to control (p < 0.05). Pearson correlation tests were interpreted according to the guide Evans (1996) suggested. According to Evans’ empirical classification, the correlation strength can be interpreted using absolute values of Pearson correlation, r. less than 0.20 is very weak, 0.20–0.39 is weak, 0.40–0.59 is moderate, 0.60–0.79 is strong and 0.80 or greater is very strong correlation . It is commonly accepted that higher absolute values and smaller associated p values imply a stronger departure from a null hypothesis of no correlation.
| 3. Results and discussion | ▴Top |
In the present study, eight different lighting ratios (%) (Figure 1) on the microgreens were studied and phytochemical contents and antioxidant activities were analyzed for each microgreen. The effects of each treatment lighting were investigated, and interpretations were based on Tukey’s HSD, Dunnett’s test and Pearson’s correlation coefficients. The observed changes of increasing blue and amber lights on the phenolic contents and antioxidant activities in microgreens were analyzed using Pearson’s correlation coefficient. When comparing individual treatment effects against control (basal) conditions, only treatments that were significantly different will be discussed based on maximum changes in content (positive and negative).
3.1. Effects of lighting on total phytochemical content of microgreens
The TPC, TFC, and TAC of the studied microgreens were between 9.8–16.7 mg GAE/g DW (Figure 3a–c), 3.7–12.5 mg CE/g DW (Figure 3d–f) and 0.06–0.12 mg C3GE/g DW (Figure 3g–i), respectively. The effects of the lighting on phytochemical accumulation in the microgreens varied significantly depending on the lighting conditions and species (p < 0.05). Most treatments enhanced the TPC in certain microgreens with mixed effects on TFC and little change and an inhibitory effect on TAC.
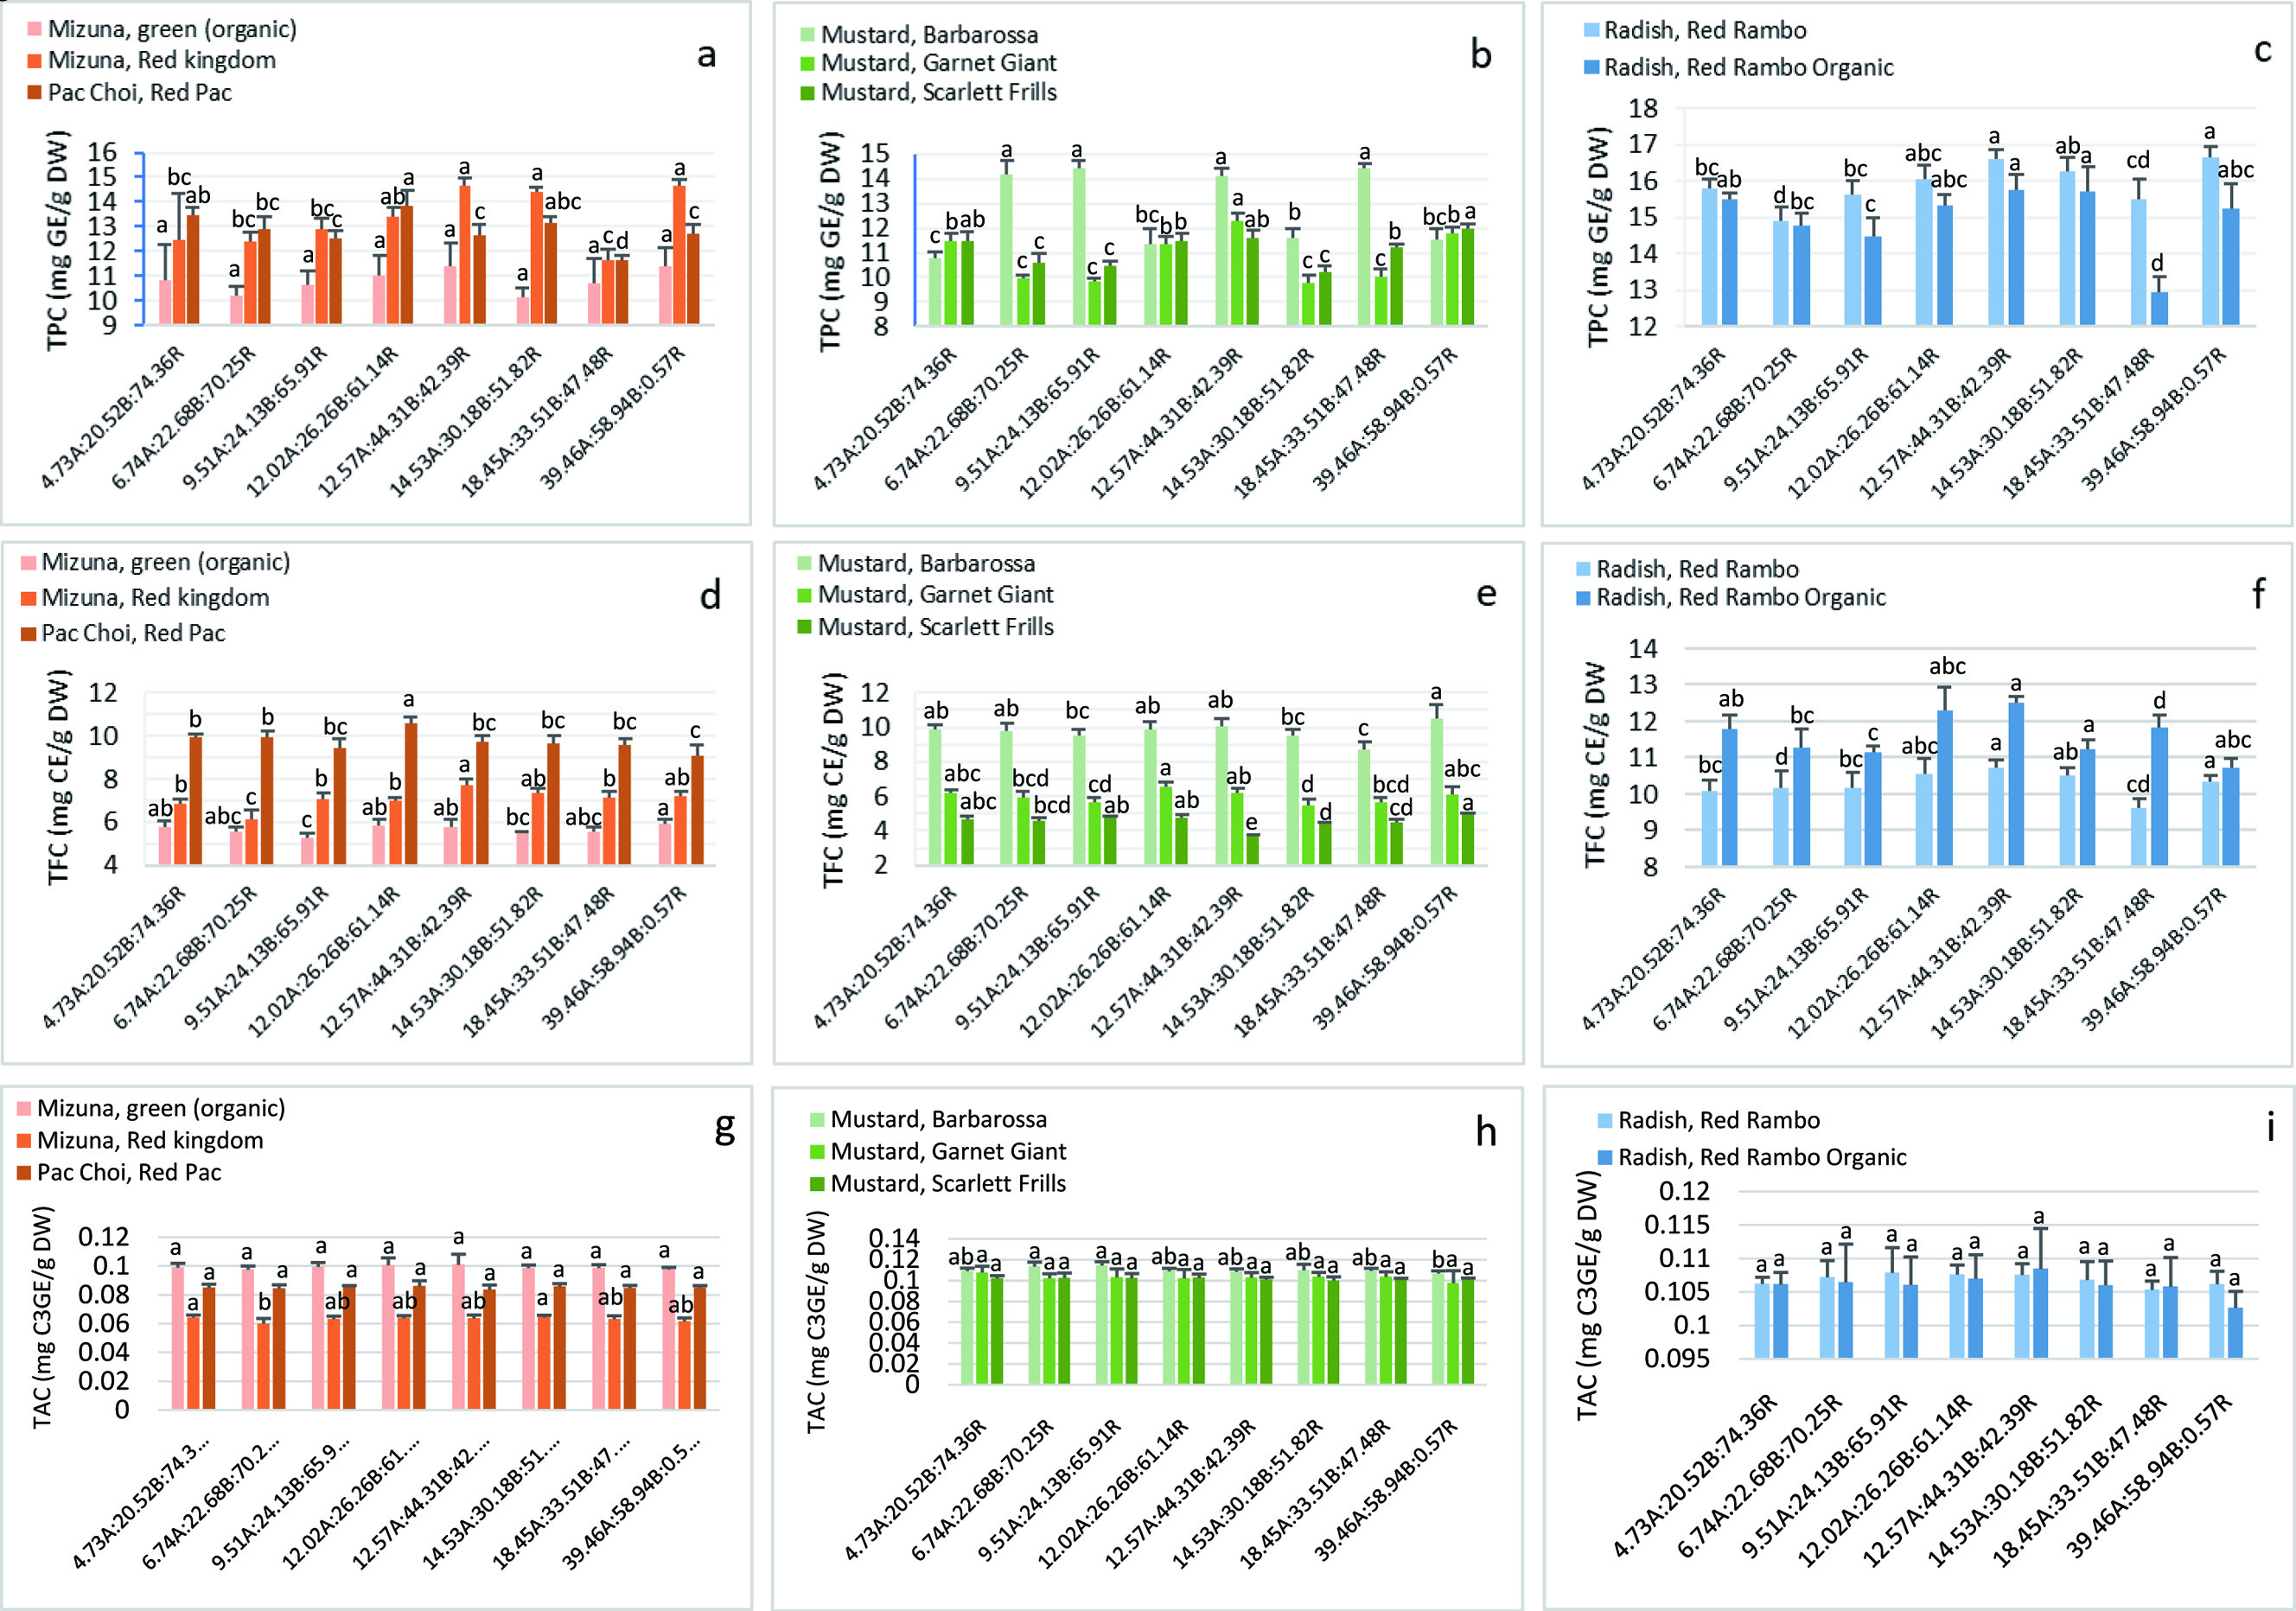 Click for large image | Figure 3. Total phenolics content (TPC) (a–c) total flavonoids content (TFC) (d–f), and total anthocyanins content (TAC) (g–i) in the microgreens. Values are expressed as mean ± SD (n = 6). Values with the same letter in each group are not significantly different (p < 0.05). TPC: total phenolics content (mg gallic acid equivalent GE/g dry weight (DW)); TFC: total flavonoids content (mg catechin equivalent CE/g DW); TAC: total anthocyanin content (mg cyanidin-3-glucoside C3GE/g DW). |
3.1.1. TPC
TPC was generally enhanced by overall treatments in more than half the microgreens studied. Under amber lighting one half of the microgreens (MO, MR, MS, RR) showed moderate correlation (r = 0.48–0.58) while the other half (PC, MB, MG, RO) showed weak correlation (r = −0.3–0.28) (Table 2). It is generally reported that blue light positively enhances phenolic content in vegetables and herbs like lettuce, tomato and basil (Johkan et al., 2010; Kim et al., 2013; Kyriacou et al., 2020). In our study, TPC was more strongly correlated to blue light than amber light as seen in MO, MR, MS, RR (r = 0.61–0.73), moderately in MG (r = 0.53) and generally the same in other microgreens (Table 2). TPC is also shown to be positively correlated with amber (595 nm) light in a study done on two radish varieties grown under HPS light as control, an observation seen in our conventional radishes RR (Samuolienė et al., 2011; Urbonavičiūtė et al., 2009). Out of all microgreens, both radishes (RR, RO) contained the highest overall TPC while MG and MO had the lowest. A recent study comparatively evaluating different families of microgreens made a notable observation regarding the high TPC of their radish microgreens compared to a least seven other microgreens (Ghoora et al., 2020). This pattern was also seen in our radishes compared to the six other microgreens of the same family (Figure 3c). Phenolic compounds are linked to blue light receptors and results in the current study shows that increasing both amber and blue light enhanced TPC, and similar observations have been noted elsewhere in different Brassica vegetables (Park et al., 2019; Vaštakaitė-Kairienė et al., 2015). Blue light has a pronounced effect on flavonoids and phenolic acid synthesis, and this could be linked to their capacity for absorbing shorter wavelengths (Kyriacou et al., 2019b; Park et al., 2019). Positive correlations were reported between the TPC, FRAP and DPPH antioxidant activities in radish and mustard microgreens (Ghoora et al., 2020), winter rapeseed varieties of Brassica napus (Szydlowska-Czerniak et al., 2010), broccoli (Borowski et al., 2007) and lettuce (Liu et al., 2007). The increase in TPC is attributed to the effect by increased blue and amber light on synthesis of specific types of phenolics, like phenolic acids which are found in high quantities in Brassica microgreens (Harbaum et al., 2007; Kyriacou et al., 2019b).
Click to view | Table 2. Overall amber and blue light effectiveness on phenolic contents and antioxidant activities based on Pearson correlation analysis (r-Pearson)a |
Means that were significantly different from one another were determined using Tukey’s HSD. The best combined lighting ratio out of all treatments for producing the highest content in MO, MR, MS and RR is 39.46A:58.94B:0.57R and for MG is 12.57A:44.31B:42.39R (Figure 3a–c). When comparing individual treatment effects against control conditions, overall maximum lighting conditions significantly increased TPC in MR, MS and RR by 4–18% while 18.45A:33.51B:47.48R and 12.57A:44.31B:42.39R significantly increased TPC in MB and MG by 34% and 7%, respectively (Table 3). Generally, a significant decrease in TPC was observed in RR under 6.74A:22.68B:70.25R (6%), in MS under 14.53A:30.18B:51.82R (11%) and in both PC and RO under 18.45A:33.51B:47.48R (13% and 17%, respectively).
Click to view | Table 3. Net changes (%) of total phenolic, flavonoid and anthocyanin contents and antioxidant activities |
The current findings agree with literature values and patterns which suggest that blue lights are responsible for phenolics synthesis, such as that seen in microgreen species; however, red light in combination with blue has also been reported to synthesize phenolic compounds (Kyriacou et al., 2019b). There is ample evidence of blue light induced phenolic acid and flavonoid biosynthesis in plants through the expression of key enzymes in the phenylpropanoid pathway (Chatterjee et al., 2006; Taulavuori et al., 2018; Zoratti et al., 2014). This response to oxidative stress is species-specific and transcriptional responses are still poorly understood. One study explains that exposure to both red and blue wavebands could promote photoisomerization of phenolic compounds which makes quantification relatively difficult (Kyriacou et al., 2019b). Investigation into genotype-wavelength interaction and the underlying enzymes that control phenolics synthesis is recommended for light-tailored biosynthesis, and is currently being studied in our laboratory.
3.1.2. TFC
Only PC showed a strong negative correlation (r = −0.63) with amber light, while moderately positively correlated in MO (r = 0.4) and negative in RO (r = −0.45), weak in MR, MB, MS and RR (r = 0.03–0.37), and very weak in MG (r < 0.2) (Table 2). Like TPC above, highest TFC is evident in both radishes (RR, RO) while MS and MO contained the content. Similar correlations were seen under blue light for MO (r = 0.49) and PC (r = −0.63), higher for MR (r = 0.57) and MB (r = 0.44) and lower for RO (r = −0.19) (Table 2). Generally, a species-specific response is seen for flavonoid accumulation under the current lighting and it is suggested that energy-rich short wavelengths alone like blue light might promote flavonoid biosynthesis to quench the higher photo-oxidation potential generated (Kyriacou et al., 2019b). Blue light is close to UV-A on the light spectrum and both are detected by cryptochromes, therefore it is not unreasonable to assume dose-dependent oxidative stress on the plant system in response to short wavelength. In response to this, modulation and expression of key enzymes would assist the counteraction of this oxidative stress (Hasan et al., 2017; Kyriacou et al., 2019b).
A study investigating different ratios of red and blue light on flavonoids synthesis in red and green basil microgreens found species-specific responses to the lighting in which one cultivar dominated flavonoid accumulation under a higher red ratio while the other under balanced red and blue ratios (Lobiuc et al., 2017). Another study examining increasing doses of supplementary green light (500–599 nm) to red and blue lights on flavonoids synthesis in green and purple basil leaves found an inhibitory response under a higher ratio and no effect under a lower one (Dou et al., 2019). Our study using 590 nm (amber) falls within their green light range which could indicate why our microgreens were not linearly responsive to the lighting. In any case, our amber light conditions supplementary to red and blue components could be used for increasing total flavonoids in certain microgreens although individual components may vary in their responses (Table 3). When comparing overall means, the best overall lighting ratio producing the highest content in MO, MB and MS is under 39.46A:58.94B:0.57R and for MR and RR is 14.53A:30.18B:51.82R (Figure 3d–f).
Generally, the effects of the treatments on TFC compared to control were negative in the microgreens (Table 3). There was a maximum significant decrease in TFC under 6.74A:22.68B:70.25R for MR (11%), under 9.51A:24.13B:65.91R for MO (9%), under 12.57A:44.31B:42.39R for MS (21%), under 14.53A:30.18B:51.82R for MG (12%), under 18.45A:33.51B:47.48R for MB (12%), and under 39.46A:58.94B:0.57R for both PC and RO (8 and 8% respectively). Maximum increases in TFC was measured under 12.57A:44.31B:42.39R for MR, RO and RR (12%, 6% and 6%, respectively), under 12.02A:26.26B:61.14R for PC (7%) and under 39.46A:58.94B:0.57R for MS (5%).
3.1.3. TAC
Almost all microgreens, except for PC, showed negative correlations between the amber lighting and TAC suggesting amber light had inhibitory effects on anthocyanin synthesis (Table 2). Only PC microgreens were weakly positively correlated with amber r < 0.2) while all others showed negative correlations. In particular, very strong negative correlations existed between the lighting and TAC of MG (r = −0.81), strong negative in MB and MG (r = −0.6 and −0.81, respectively), moderately negative in RR and MS (r = −0.42 and −0.59, respectively) and weakly negative in MO and MR (r = −0.37 and −0.23, respectively). On the other hand, TAC correlation with blue light was slightly different than amber light, however all microgreens showed negative correlations between TAC and blue lighting. Both MO and MR microgreens were very weakly correlated with blue (r < 0.2), RR and PC were weakly negatively correlated (r = −0.25 and −0.33), RO was moderately negatively correlated (r = −0.49) and MB, MG and MS were strongly negatively correlated (r = −0.68, −0.75 and −0.64, respectively) (Table 2).
Although a very weak association was recorded between the lighting and TAC of PC, no general conclusion can be made regarding which treatment was more favorable and if the treatments were at all beneficial. In the current study, microgreens did not benefit from any mixed ratios of amber, blue and red lighting and may have inhibited anthocyanin accumulation.
When compared to control conditions, only the TAC of MR microgreens was significantly decreased under 6.74A:22.68B:70.25R by 2% (Table 3). TAC was not significantly changed from control in all microgreens, which suggests that the expression and accumulation of anthocyanins were not significantly modulated by these light combinations (Figure 3g–i). In addition to light quality by blue light, higher intensities within that range promotes anthocyanin synthesis for defense against short-wave energy light. This is evident in kohlrabi microgreens (Gerovac et al., 2016) and not in ours. The PPF of blue light in the current study set-up was insufficient for stimulating a positive response. Even under shorter wavelengths like UV-A, anthocyanin accumulation is still dependent on PPF and follows a dose-response relationship which is shown in anthocyanin-rich grape skins (Kataoka et al., 2003) and turnip leaves (Zhou et al., 2007). A contradictory report in kale microgreens show that anthocyanin accumulation is not always dose-dependent with intensity which could lead to the possibility that wavelength (spectral quality) selection may play an equal or more significant role in secondary metabolite synthesis (Lefsrud et al., 2008). Higher intensities are shown to stimulate anthocyanin synthesis under an overall combined lighting irradiance of 320–440 μmol m−2 s−1 (Samuolienė et al., 2013) or a blue light irradiance of 75 μmol m−2 s−1 (Vaštakaitė-Kairienė et al., 2015), as shown in PC microgreens under 280 μmol m−2 s−1 and in two amaranth microgreens (Meas et al., 2020). Our overall lighting (179–197 μmol m−2 s−1) intensities for all treatments were insufficient for TAC accumulation as we expected therefore special attention should be given to modulating overall intensity for targeted anthocyanin synthesis.
Common plant acclimation responses to environmental stressors is the accumulation of different antioxidants and secondary metabolites, such as ascorbate, flavonoids, and tocopherols (Jansen et al., 2008). Although TAC was negatively affected in the majority of our microgreens, anthocyanin synthesis requires prolonged exposure to high PPF for a beneficial response which can partly be related to the species and experimental conditions (Frazie et al., 2017; Mancinelli et al., 1991). The negative correlation between overall lighting may simply indicate the pathway toward anthocyanin synthesis was affected or diverged to other directions. Cryptochrome and phytochrome signaling pathways are involved in photo-regulation of anthocyanin synthesis when plants are exposed to prolonged irradiation (Liu et al., 2016). Since red and amber lights are exclusively detected by phytochrome and blue light is involved in the excitation of electrons in both photoreceptors, the difference in anthocyanin synthesis is mainly attributable to cryptochrome activation in response to blue light (Kong et al., 2019; Mancinelli et al., 1991).
3.2. Effects of lighting on DPPH, FRAP and ORAC antioxidant activities of microgreens
Antioxidant activities of the studied microgreens measured by DPPH, FRAP and ORAC methods were between 74–173 µM TE/g DW (Figure 4a–c), 25–127 µM AE/g DW (Figure 4d–f) and 515–1,652 µM TE/g DW (Figure 4g–i), respectively. Total antioxidant activities obtained by these methods collectively provides valuable information during the early stages of study to select optimal conditions for the goal of enhancing the antioxidant activity of microgreens (Iqbal et al., 2012).
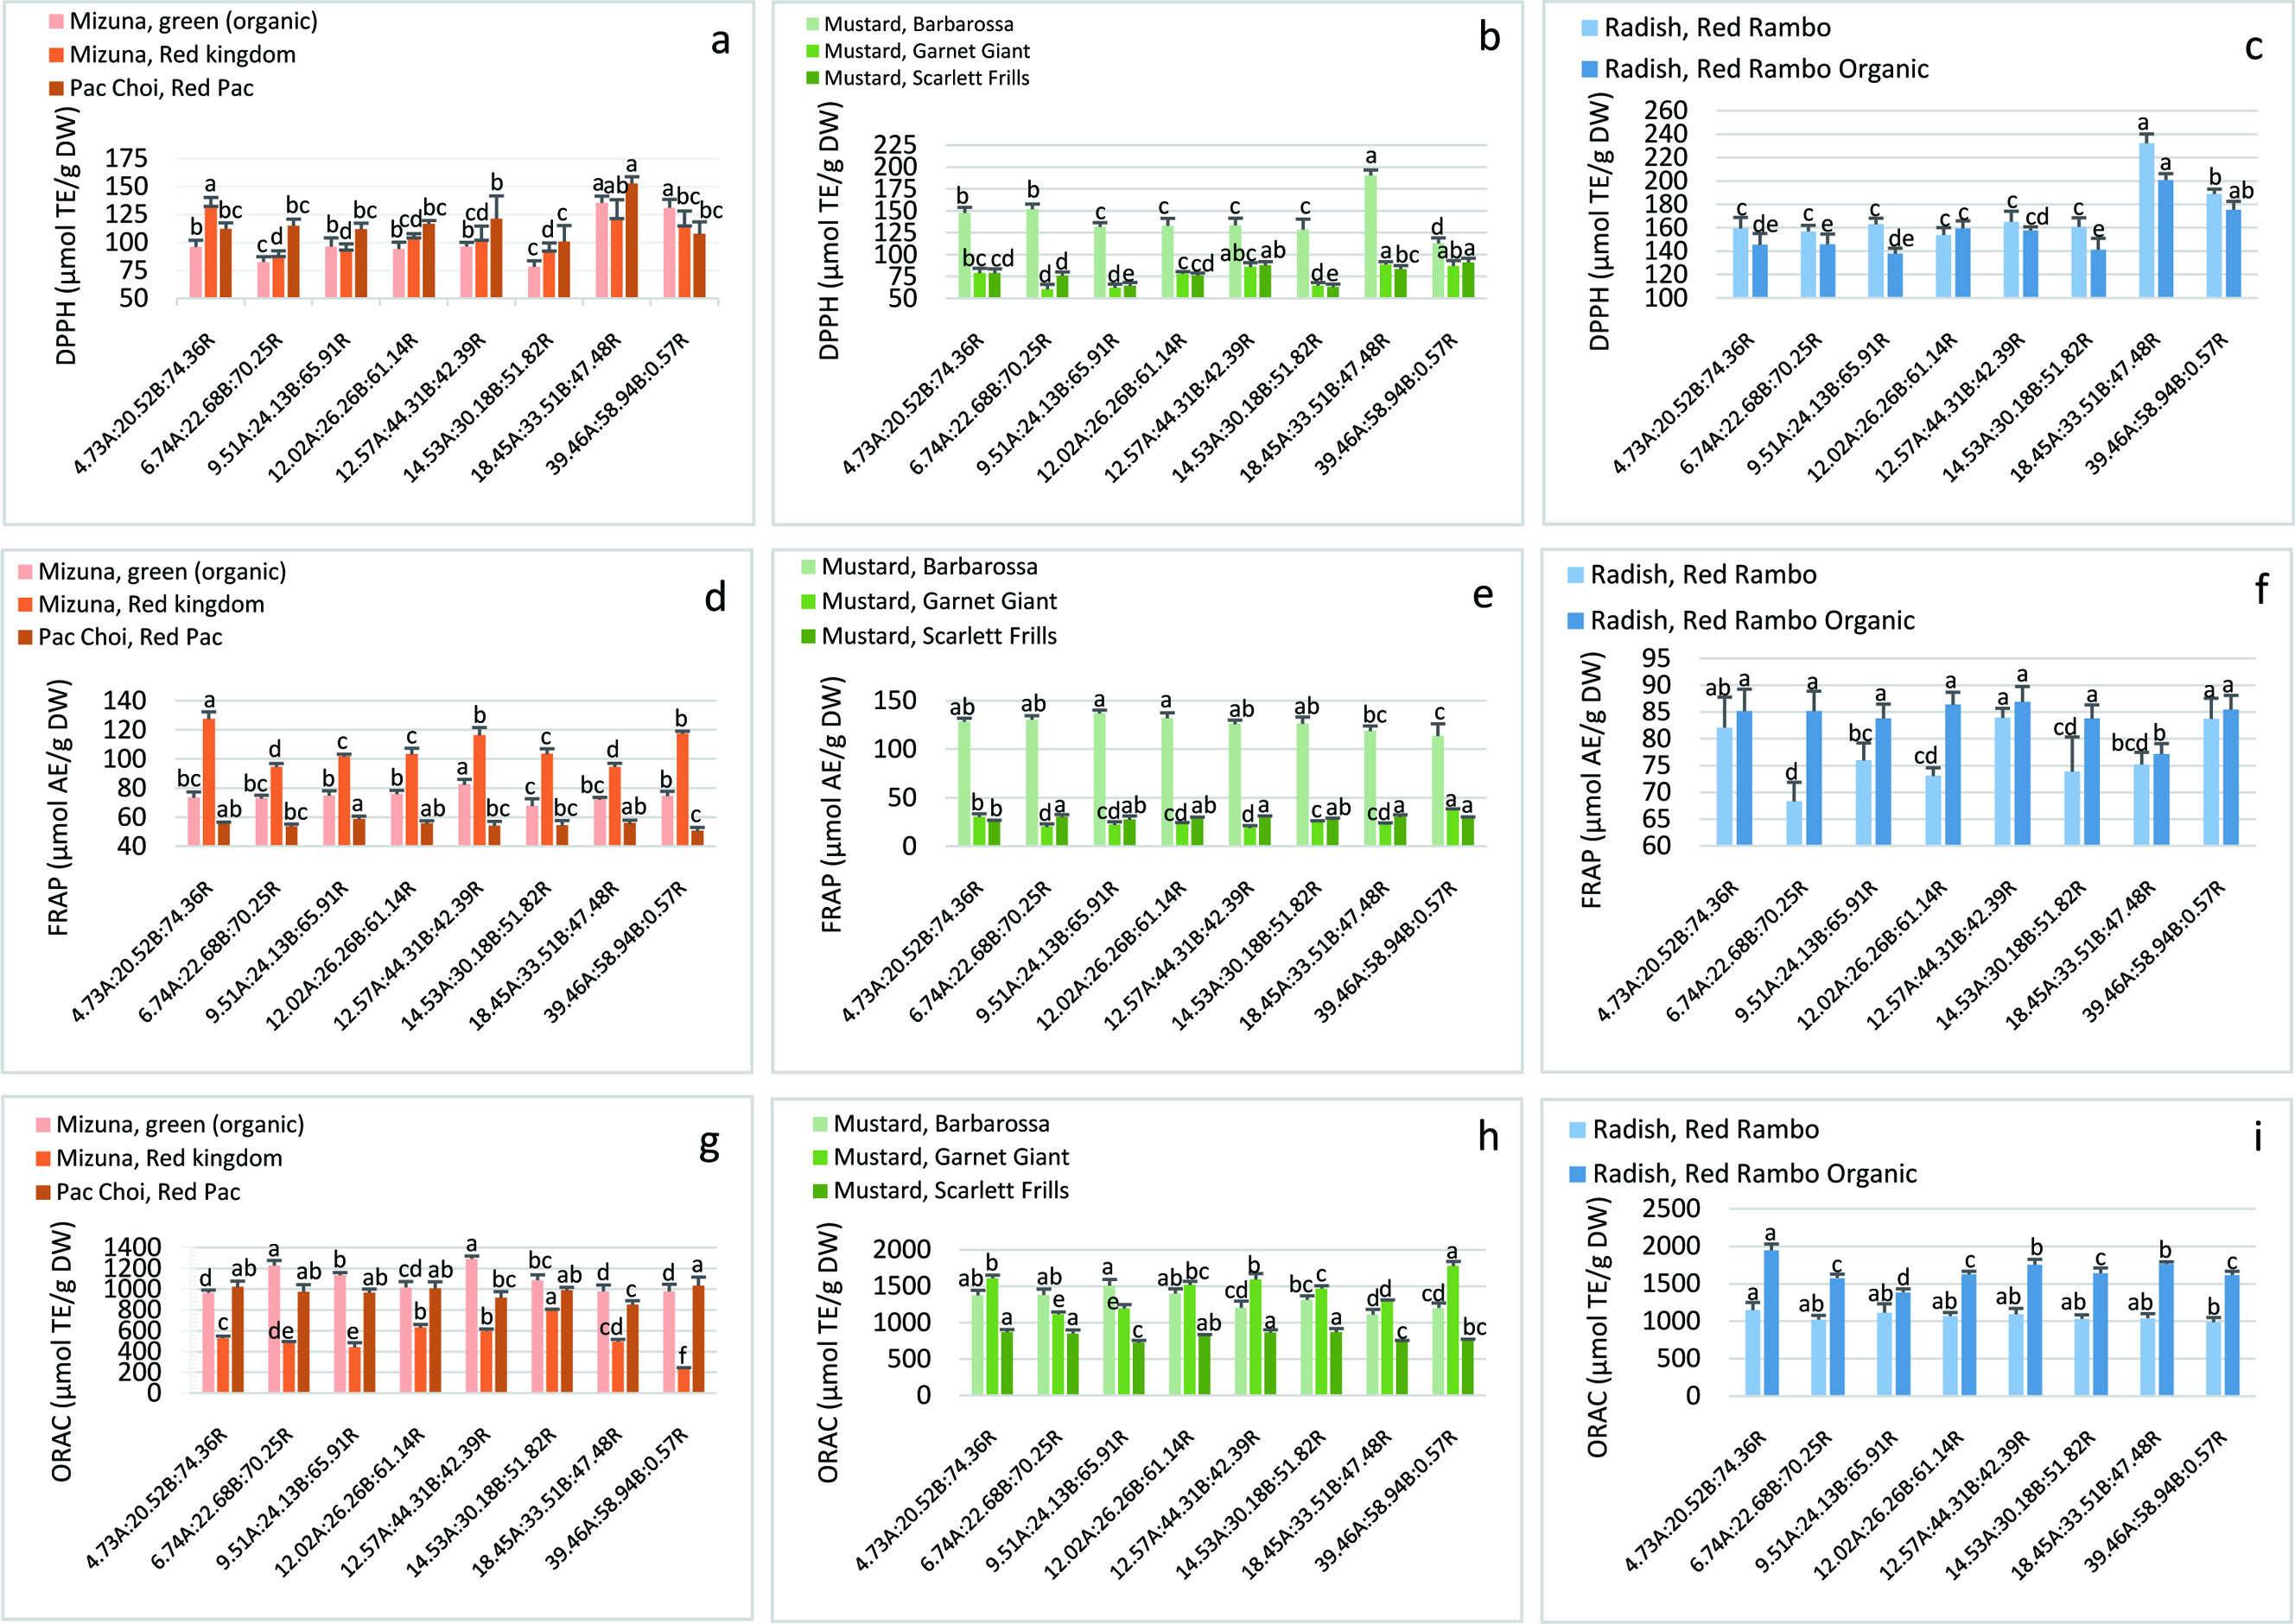 Click for large image | Figure 4. Antioxidant activities in the microgreens as measured by DPPH, FRAP and ORAC methods. Values are expressed as mean ± SD (n = 6). Values with the same letter in each group are not significantly different (p < 0.05). DPPH: 2,2-diphenyl-1-picrylhydrazyl assay (µmol Trolox equivalent Trolox equivalents TE/g dry weight (DW)); FRAP: ferric reducing antioxidant power assay (µmol ascorbic acid equivalent AE/g DW); ORAC: oxygen radical absorbance capacity assay (µmol TE/g DW). |
3.2.1. DPPH
DPPH antioxidant activity was strongly correlated with the amber lighting in MO (r = 0.71), moderately correlated in MG, MS, RR and RO (r = 0.5–0.57), weakly correlated in MR and MB (r = 0.29 and −0.3, respectively) and very weak in PC (r < 0.2) microgreens (Table 2). Blue light correlations with DPPH were slightly different than amber. MO, MG and MS microgreens showed the strongest correlations between DPPH and blue light (r = 0.60, 0.62 and 0.69, respectively), moderately in RO (r = 0.50), weakly in MB and RR (r = −0.38 and 0.39, respectively) and very weak in MR and PC (r < 0.2) (Table 2). A recent study reported a reduction in DPPH antioxidant activity in PC under different pulsed-LED frequencies of yellow (590 nm) LEDs (Vastakaite et al., 2017). Another study found that increasing blue light intensity significantly enhanced DPPH antioxidant activity in two pac choi cultivars (Zheng et al., 2018). Only under a ratio of 18.45A:33.51B:47.48R did we find a significant increase in DPPH antioxidant activity from control in PC microgreens (Table 3). Although no pulsating light was used in our current study or high intensity blue light, we did not find any significant correlations between overall lighting and DPPH in our PC microgreens.
DPPH antioxidant activity was generally enhanced by the overall treatments by increasing both amber and blue light ratios with minimal red light. Our results on both radishes agree with a previous study on radish leaves showing DPPH antioxidant activity, in addition to the TPC, can be enhanced under supplementary amber (595 nm) light with red and blue basal components as opposed to HPS lighting as control (red light at ∼200 μmol m−2 s−1) (Urbonavičiūtė et al., 2009) (Figure 4c). However, this study reported suppression of monosaccharide and vitamin C accumulation in the radish leaves under supplementary amber which could suggest both amber and blue lights induced mild stress on the plant system. This resulted in the enhancement of the phenolics pool serving as defense against oxidation (Urbonavičiūtė et al., 2009). According to Tukey’s HSD, the lighting ratio that produced the highest content in the microgreens is 18.45A:33.51B:47.48R, except for MS under 39.46A:58.94B:0.57R (Figure 4a–c).
The effects of the treatments on antioxidant activity compared to control were mixed among the microgreens (Table 3). Treatment 6.74A:22.68B:70.25R caused a maximum significant decrease in DPPH activity in MG and MR (23% and 34%, respectively) and 14.53A:30.18B:51.82R caused a significant decrease in MO and MS (18% and 20%, respectively). On the other hand, DPPH was significantly increased under 18.45A:33.51B:47.48R in all microgreens (13–46%), except no effect in MR and increased in MS (16%) under maximum amber and blue light conditions. According to an earlier study, the radical quenching ability of phytochemicals can differ depending on species and assays used which was compared in mustard, tatsoi and PC microgreens grown under 5 doses of blue LEDs (Vaštakaitė-Kairienė et al., 2015). In the current study, DPPH antioxidant activity was generally positively affected by the lighting treatments under increased blue and amber lighting in most microgreens.
3.2.2. FRAP
Antioxidant activity measured by the FRAP method showed similar and slightly different results compared to DPPH measured antioxidant activity results. Mixed weak, very weak and moderate correlations were measured in MO, MR, MS, RR and RO between FRAP and amber lighting (r = −0.1 to 0.42) compared to DPPH which was generally weakly to moderately correlated to amber lighting (Table 2). Moderate to strong correlations between FRAP and amber lighting existed in PC and MB (r = −0.67 and −0.82, respectively) and MG (r = 0.67). FRAP was also strongly negatively correlated with blue light in PC and MB microgreens (r = −0.72 and −0.79, respectively) and strongly positively correlated with RR (r = 0.62), moderately in MG and MS (r = 0.48) and weakly correlated in MO and MR (r = 0.3–0.34) (Table 2).
AA is a strong antioxidant that is naturally found in plant cells and plays an important role in reducing oxidation caused by ROS. Since ROS are constantly produced by metabolically active plants, enhancing compounds like AA and other antioxidant compounds is important for mitigating plant cellular damage. A recent study found supplementary yellow (595 nm) to red and blue components increased AA content in kohlrabi microgreens, but the same effect was not observed in mizuna and broccoli microgreens (Samuolienė et al., 2019). Although our study did not examine the AA content, we determined the antioxidant activity according to an ascorbic acid standard (Figure 4d–f). Generally, we found increasing blue light to be benefit antioxidant activity by FRAP method in most microgreens compared to amber light.
Means were statistically compared and the best lighting ratio for producing the highest antioxidant activity by FRAP method in MG is 39.46A:58.94B:0.57R, for MR is 4.73A:20.52B:74.36R, for MS is 12.57A:44.31B:42.39R and for RR is 14.53A:30.18B:51.82R (Figure 4d–f). Maximum values for FRAP antioxidant activity varied among the microgreens and treatments without a general pattern like DPPH. Compared to control, FRAP was significantly and maximally decreased in MR and RR under 6.74A:22.68B:70.25R (26% and 1%, respectively), in MG under 12.57A:44.31B:42.39R (38%), in MO under 14.53A:30.18B:51.82R (8%), in RO under 18.45A:33.51B:47.48R (9%) and in MB and PC under maximum blue and amber 39.46A:58.94B:0.57R (11 and 9%, respectively) (Table 3). FRAP activity was also significantly and maximally increased in MO and MS under 12.57A:44.31B:42.39R (12% and 19%, respectively) and in MG under 39.46A:58.94B:0.57R (10%).
3.2.3. ORAC
Mostly all microgreens showed negative correlations between the lighting treatments and antioxidant activity measured by the ORAC method with mixed strengths of association. Correlations between lighting and ORAC were very weak in RO (r < 0.2), weak (r = −0.37) in MO, moderate in MR, MB, MS (r = −0.58, −0.57, −0.48, respectively) and strong in RR (r = −0.71). Only weak and moderate positive correlations between the overall lighting and ORAC existed in PC (r = 0.14) and MG (r = 0.55), respectively (Table 2). Similar correlations were seen under blue light for ORAC with a strong negative correlation in MB (r = −0.67) and strong positive in MG and RO (r = 0.64 and 0.83, respectively).
The best lighting ratio for producing the highest antioxidant activity by ORAC method in PC and MG microgreens occurred under maximum amber and blue light ratios with the least amount of red light, 39.46A:58.94B:0.57R (Figure 4g–i). Generally, antioxidant activity by ORAC method was negatively affected by the lighting compared to control conditions. Maximum significant decreases from control were seen in MG under 6.74A:22.68B:70.25R (26%), in MS and PC under 9.51A:24.13B:65.91R (16 and 17%, respectively), in PC under 18.45A:33.51B:47.48R (17%) and in MR and RR under 39.46A:58.94B:0.57R (56% and 14%, respectively). The largest significant increases were measured in MB under 9.51A:24.13B:65.91R (10%), in MO under 12.57A:44.31B:42.39R (34%), in MR under 14.53A:30.18B:51.82R (49%), and in MG under 39.46A:58.94B:0.57R (11%) (Table 3).
Although the ORAC assay is regarded as the most sensitive and relevant to biological system (hydroxyl radical), many studies including ours have not shown consistent correlation between its value and phytochemicals such as phenolics (Li et al., 2012). A report on several mustard varieties showed that the lowest correlation was observed between ORAC and TPC suggesting that phenolics are exclusive to overall antioxidant potential (Szydlowska-Czerniak et al., 2010). The mechanisms and kinetics of the antioxidant action in the ORAC assay may inherently lack overall correlation with phenolics (Zhang et al., 2015). For this reason, a close examination in our future studies on the phenolic compositions i.e. individual phenolic compounds become imperative. One possible reason ORAC was overall negatively impacted by the lighting in the microgreens may be due to the rigid control over reaction conditions which can compromise use of this assay. Occurrence of very long reaction times without substantial fluorescein could be another potential reason for the negative ORAC values (Schaich et al., 2015). Nonetheless, ORAC antioxidant screening provides important tools for preliminary evaluation and screening of antioxidants and comparability between species and genus.
While only in vitro antioxidant activities were measured in the present study, the validity of these as indicators of potential health needs to be confirmed in vivo. Higher in vitro antioxidant activity often leads to reduced oxidative stress-related chronic diseases; however, it may not always be the case. Research on the use of LED for the enhancement of bioactives in microgreen is a relatively new field, and results such as that presented here will lead to further investigations into specific compounds and how they may contribute to in vivo bioactivities. Currently, even in vitro studies are still scarce for bioaccessibility related studies in microgreens, especially for Brassica species (Khoja et al., 2020). A great deal of evidence exists on the health benefits of Cruciferous vegetables; however, only one animal study exists to date to study the effects of anthocyanin-rich red cabbage microgreens. Red cabbage microgreen supplementation attenuates high-fat diet induced weight gain and lowered expression of inflammatory cytokines in the liver thus potentially protecting against cardiovascular disease through inhibition of hypercholesterolemia (Huang et al., 2016).
3.3. Principal Component Analysis (PCA)
While correlation and regression analysis provide information on the effect of overall lighting on phenolic contents and antioxidant activities, PCA explains overall variations and reduces the dimensionality of large data sets such as ours. In this study, the proportions of eigenvalues of the correlation matrix for the first three principal components were 51%, 27.8% and 9.3% (Figure 5). The top two components accounted for 78.8%, and all these three components explained 88.1% of the total variance, indicating that two or three components provided a good summary of the data. Biplots in which the points represent microgreens treated by various light ratios and the vectors represent phenolics content and antioxidant activity measured by different methods.
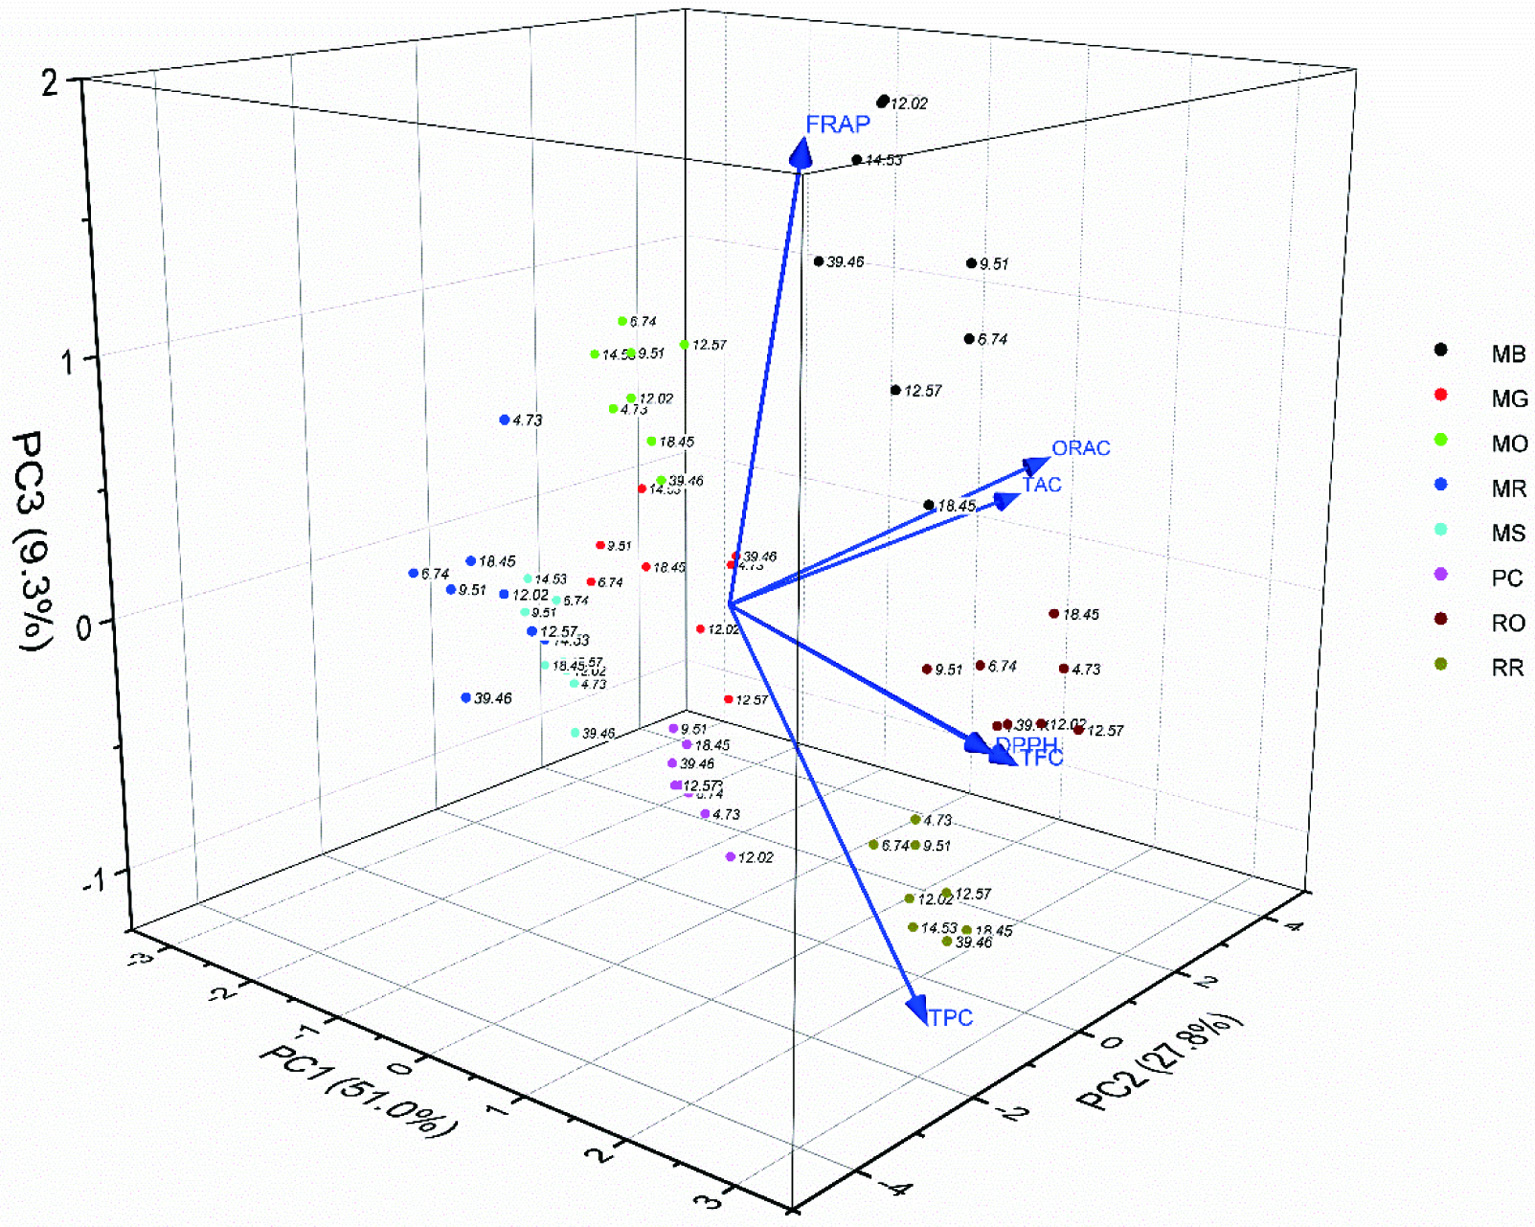 Click for large image | Figure 5. Biplot of the principle components 1, 2 and 3 describe groups of phytochemicals (TPC, TFC, TAC) and antioxidant activities (DPPH, FRAP, ORAC) of eight microgreens under eight treatments. Treatments are labeled with only amber light % for legibility. Ratios are 4.73A:20.52B:74.36R; 6.74A:22.68B:70.25R; 9.51A:24.13B:65.91R; 12.02A:26.26B:61.14R; 12.57A:44.31B:42.39R; 14.53A:30.18B:51.82R; 18.45A:33.51B:47.48R; 39.46A:58.94B:0.57R. Each data point on the biplot represents averaged values of six biological repeats (n = 6). MB: Mustard, Barbarossa; MG: Mustard, Garnet giant; MO: Mizuna, organic; MR: Mizuna, red kingdom; MS: Mustard, Scarlet Frills; PC: Pac choi, red Pac; RO: Radish, red Rambo organic; RR: Radish, red Rambo |
The directions of the vectors indicate that PC1 mainly explains DPPH antioxidant activity; PC2 appears to represent ORAC antioxidant activity; and PC3 seems to be related to FRAP antioxidant activity. Vectors pointing in the same direction are closely correlated, such as the relationship between TFC, TPC and DPPH, and between TAC and ORAC. These correlations are consistent with other Brassica species and other herb microgreens (Deng et al., 2013; Li et al., 2018; Samuolienė et al., 2016; Xiao et al., 2019) A 90° angle between vectors, such as the pair of TFC and TAC, indicates no correlation. The results suggest that the DPPH activity was primarily determined by both TPC and TFC, whereas the ORAC activity was largely governed by TAC. The FRAP activity could not generally be ascribed to TPC or any of its sub-groups i.e. TFC or TAC.
3.3.1. Effect of variety on phytochemical content
Samples that are clustered together in the biplot are those that possess similar profiles of properties. The distribution of points on the biplot showed that effect of variety dominated the variance compared to the treatment effect from combined light ratios. All the varieties were clearly separated by the PCA biplot, even between the RR and its organic counterpart RO. RR was featured with high TPC, while RO with higher TFC than TPC (Ghoora et al., 2020). RO is genetically identical to RR but having less similarities in TPC. MB is unique for its high FRAP antioxidant activity, as distinct from the same family MG and MS which are the lowest in all parameters. MR and MO showed intermediate properties of phytochemical contents and antioxidant activities among the microgreens.
3.3.2. Effect of overall amber, red and blue lighting on phytochemical content
Most microgreens were responsive to the increasing ratios of amber and blue light and decreasing red (Figure 3). TPC of RR increased with the increasing amber and blue light but in its organic counterpart RO, TFC was increased. MR appeared to be very sensitive and responsive to the increases of amber and blue lighting while MB and PC were only moderately sensitive and responsive. Until today, only a few studies have looked at increasing amber light effects on phytochemical synthesis, thus comparisons can often be difficult if baseline values have not been established (Vastakaite et al., 2017; Vaštakaitė et al., 2018). Comparison of general trends like that in the current study would better suit growers’ need to supplement amber light to red and blue components depending on the type of species being grown.
| 4. Conclusion | ▴Top |
Our study does report for the first time the effect of different amber and blue light ratios combined with red light on the phenolic contents (TPC, TFC, TAC) and antioxidant activities by DPPH, FRAP, and ORAC assays in several Brassica microgreens. The current results suggest overall lighting using amber, blue and red lights on TPC or its sub-group TFC were species-dependent, while TAC was negatively influenced by the spectral combinations in our study. The variability in the correlations between the total phenolic and flavonoid components and the antioxidant activities of the different microgreens may also depend on the assays employed. All antioxidant assays used in the present study are chemical based methods by slightly different mechanisms and no specific correlations has been found between results of these assays.
The overall trends of the lighting on phenolic contents and antioxidant activities were compared and PCA indicated that the eight microgreen varieties could be divided into three groups based on phenolic content and sensitivity to the lighting. Those that are highly responsive to treatments with amber, red and blue light and high in DPPH antioxidant activity, TPC and TFC such as RR and RO; MB and MR that were moderately to highly sensitive to the lighting but with no clear dose-dependence; other microgreens that were not sensitive to the lighting nor showed dose-dependent responses.
Using LEDs for microgreen production in controlled environment agriculture with goals for enhancing phytochemical profiles and specific nutrients is a relatively new area of research, and the present study is the first step towards the use of amber light at different doses supplementary to red and blue basal lighting. Considering the diverse phenolic composition of the different plants, and the fact that other antioxidant phytochemicals such as carotenoids and glucosinolates found in Brassica microgreens contribute also to overall antioxidant benefit, future studies should not only include the effect on individual phenolics but examine other phytochemical components and the mechanisms underlying the effect of LEDs. Identification of bioactive compounds responsible for the observed effects and their variations is in progress and will be communicated in the near future. Furthermore, understanding gene activation under certain LED conditions will surely lead to the development of species-specific lighting systems to enhance all-around productivity and to enhance beneficial and important antioxidant compounds.
Acknowledgments
This study was supported by the A-base funds of Agriculture & Agri-Food Canada (AAFC). Project #J-001328.001.04 and #J-002228.001.07.
Conflict of interest
The authors declare no competing financial interest.
| References | ▴Top |