| Journal of Food Bioactives, ISSN 2637-8752 print, 2637-8779 online |
| Journal website www.isnff-jfb.com |
Review
Volume 10, June 2020, pages 9-19
An overview of Brazilian smoothies: from consumer profile to evaluation of their physicochemical composition, bioactive compounds, antioxidant activity and sensory description
Lorene Simioni Yassina, Acácio Antonio Ferreira Zielinskib, Aline Albertia, Paulo Ricardo Losa, Ivo Mottin Demiatea, Deise Rosana Silva Simõesa, Alessandro Nogueiraa, *
aGraduate Program in Food Science and Technology, State University of Ponta Grossa, Av. Carlos Cavalcanti 4748, CEP 84.030-900 Ponta Grossa, PR, Brazil
bDepartment of Chemical Engineering and Food Engineering-Federal University of Santa Catarina (UFSC), Florianópolis, SC, 88010-970, Brazil
*Corresponding author: Alessandro Nogueira, Graduate Program in Food Science and Technology, State University of Ponta Grossa, Av. Carlos Cavalcanti 4748, CEP 84.030-900 Ponta Grossa, PR, Brazil. Tel: 55 42 3220 3775; E-mail: alessandronog@yahoo.com.br
DOI: 10.31665/JFB.2020.10223
Received: April 1, 2020
Revised received & accepted: June 24, 2020
| Abstract | ▴Top |
In this work, the smoothies produced in Brazil were assessed through their consumption profile, chemical composition, antioxidant activity and sensory descriptions. Of the 500 volunteers who participated in this work, 30% had never heard of smoothies. The regular consumers of smoothies were young, student and single women residing in the southern region of Brazil. Strawberry, banana and pineapple were the preferred flavours. The samples (n = 17) showed significant differences (p < 0.05) in the analytical parameters evaluated. Phenols (612–1.498 mgGAE/L), ascorbic acid (8.87–24.65 AAE/L) and carotenoids (0.40–14.40 mg/L) showed high amplitude, resulting in differences of 4.9, 5.4, 11.3 and 7.6 times on the antioxidant activity of DPPH, ABTS, FRAP and CUPRAC, respectively. The flavour, residual taste, odour, colour intensity, particle presence, homogeneity, turbidity and viscosity were the main terms generated in the sensory description. These data can contribute to the development of new smoothies to better meet consumer expectations.
Keywords: Smoothies consumption; Bioactive compounds; Antioxidant activity; Sensory description
| 1. Introduction | ▴Top |
Smoothies are beverages which have variable physical, chemical and sensory characteristics due to their formulation, which contain a mixture of juice and/or fruit pulps with added (or not) cereals, vegetables, honey, tea and milk. Fibre, fructooligosaccharides (FOS), vitamins, minerals and organic acids may be naturally present, or added by processes such as fermentation, conferring various health effects and better functionality (Müller et al., 2010; Keenan et al., 2012; Nowicka and Wojdylo, 2016; Cano-Lamadrid et al., 2018).
Smoothies originated in the 1960s in the USA and returned to popularity in the 2000s when, in a short period of time, smoothies, conquered consumers worldwide in numerous different formulations (Müller et al., 2010; Titus, 2011). Studies about the applications of thermal (Markowski et al., 2017) and non-thermal food processing technologies, including high pressure processing (HPP) (Andrés et al., 2016), ultrasound (US) and ultraviolet (UV) (Wang et al., 2020), pulsed electric fields (PEF) (Timmermans et al., 2016) and ozone (Bevilacqua et al., 2018) are being developed. These technologies can extend the shelf life due to microbial and enzymatic inactivation, physical and coloring stability, better retention of functional components and antioxidant properties and also keep good sensory quality attributes of the smoothies, which is of high interest for the smoothie industry (Bevilacqua et al., 2018; Tiwari, 2018). Estimates indicate that global sales of smoothies in the beverage sector will reach U.S. $15.8 billion by the year 2022; 45.7% of this generated in the USA; 9.1% in Asia, and the remainder in other regions of the world (Global Industry Analysts, 2015). This resulted in a significant increase in the number of patents (decade 2010-20) related to smoothies (equipment, processes, formulations and packaging) belonging to American, European and Asian industries.
Different fruits are increasingly explored to develop inovative drinks with health-promoting properties. The industries that develop such products are concerned about new designs, attractive products, and the fact that such products should be compatible with health trends (Nowicka and Wojdylo, 2016; Bevilacqua et al., 2018).
However, billions of dollars are annually spent by the food and beverage industry on designs for failed products. The challenge in developing healthy new beverages is to simultaneously provide customer service, sensory acceptance and differentiation in order to achieve customer loyalty. In addition, the success of novel products and technologies in the area of foods and beverages is dependent on consumer demand (Chen et al., 2013). It is important to design products to fulfill the expectations of consumers regarding super foods, of which smoothies are considered to be typical (Medina, 2011).
Therefore, the objective of this research was to describe the current scenario regarding the consumption of smoothies in Brazil, evaluating (i) their consumption profile, (ii) their physical, chemical and nutritional composition, and (iii) their sensory characteristics.
| 2. Materials and methods | ▴Top |
Samples of smoothies (n = 17) produced in Brazil were assessed. The label specifications and characteristics were evaluated (flavour, predominant colour, ingredients, weight/volume, material package and price per kg or L expressed in US $). The samples were divided in the laboratory for sensory analysis (approved by the University of Ponta Grossa, Paraná, Brazil (UEPG) Ethics Committee, CAAE No. 56282916.0.0000.0105 and issue No. 1.649.931) and frozen (−18 °C) until the chemical analyses were performed.
Folin-Ciocalteu reagent; TPTZ (2,4,6-Tris (2-pyridyl)-S-triazine); DPPH (2,2-diphenyl-1-picrylhydrazyl); ABTS (2,2-azino-bis(3-ethylbenzothiazoline-6-sulphonic acid) diammonium salt); Trolox (6-hydroxy-2,5,7,8-tetramethylchromane-2-carboxylic acid); gallic acid; chlorogenic acid; p-coumaric acid; caffeic acid; catechin; epicatechin; phloridzin; sucrose and D-glucose were purchased from Sigma-Aldrich (Steinheim, Germany). D-fructose, acetonitrile and acetic acid were purchased from Merck (Darmstadt, Germany) and J.T. Baker (Phillipsburg, NJ, USA). The other reagents were of analytical grade. All the aqueous solutions were prepared using ultrapure water (Millipore, São Paulo, Brazil).
2.1. Consumption profile of smoothies
This part of the research was carried out by using a virtual questionnaire prepared using the Google® Forms platform. The questions were formulated with reference to market research questionnaires (Global Industry Analysts, 2015; Mintel Group, 2015). In the first phase, the single response questions were related to the consumer profile (age, gender, marital status, education level, monthly income, region of residence, religion, lifestyle and frequency of physical exercise) and the last question was regarding the concept of smoothies. The second phase of the questionnaire consisted of multiple choice questions relating to the consumption pattern (motivation for consumption, frequency, location, time, quantity and season of consumption, tastes and preferred ingredients). The research was disseminated via email and linked to social media networks. To evaluate the correct answers to the question “what is a smoothie?” similar phrases to the following definition were considered correct: “smoothies are beverages obtained by mixing fruits, fruit juices and yogurt or milk; they can be prepared at home with fresh fruit or frozen fruit pulp, or they can be purchased commercially ready to consume (Keenan et al., 2012)”. Triangulation analysis was applied to verify the convergence between the words cited in the answers to the open question about the concept of smoothies usingh the previously cited concept (Modell, 2005). The data were tabulated using the Excel® software programme and were expressed as means and percentages.
2.2. Physicochemical analysis
The soluble solids were measured using a refractometer (ABBE AR 1000 S, Megabrix, São Paulo, Brazil). The pH analyses were performed using a pH meter (Tec-3 MP, Tecnal, São Paulo, Brazil). The total titratable acidity was expressed as citric acid (g/100mL) (Latimer, 2019). The β-carotene and lycopene were extracted and quantified according to the method proposed by Rodriguez-Amaya (2001) with some modifications (Zielinski et al., 2014b). The samples were analysed in a spectrophotometer (Model Mini UV 1240, Shimadzu) at wavelengths of 450 and 470 nm for β-carotene and lycopene, respectively. The total phenols (TPC) were determined in quadruplicate by colorimetric analysis using Folin-Cicalteu reagent, as described by Singleton and Rossi (1965), and simultaneous quantification of ascorbic acid (AA), as suggested by Isabelle et al. (2010). This method is a simple modification of Folin-Ciocalteu assay and it allows to obtain the correct value of total phenols by subtracting the interference of the ascorbic acid.
2.3. Chromatographic analysis of sugar
For the quantification of sugars, the method described by Zielinski et al. (2014a) was employed. The samples were diluted 1:3 (g/mL) with ultrapure water. The suspension was maintained at 40 °C for one hour under agitation (150 rpm) (Incubator MA 1415/300, Marconi, São Paulo, Brazil) and centrifuged at 10,000 × g for 10 min (Centrifuge Excelsa II, Fanem, Brazil). The supernatant was then filtered through a membrane (0.22 μm) prior to analysis. The HPLC system used was a Waters 2695 Alliance (Milford, MA, USA), composed of a quaternary pump, degasser, an auto-injector and Waters RI 2414 refractive index detector (Milford MA, USA). The injection volume was 10 µL and the flow was 0.5 mL/min in isocratic condition with ultrapure water (Milli-Q). The column used was a Waters Sugar PakTM 1 (300 × 6.5 mm) and the detection of the samples was established by comparing the retention times with the reference standards. The quantification was calculated for the analytical curves of sucrose, D-glucose and D-fructose.
2.4. Colour parameters
The colour parameters (L*, a*, b*) were determined using a colorimeter (Minolta CM-5, Minolta Co. Ltda., Osaka, Japan). The equipment was previously calibrated with water. The samples were placed in a glass cuvette (MC A98, 10 mm) and the L*, a*, b* values were obtained in sextuplicate (Spectra Magic NX CM-S100w software, Osaka, Japan) with an observation angle of 10°. The chroma parameter (C*) was calculated according to Equation (1). The hue angle (h*) was calculated according to Equation (2).
2.5. Viscosity analysis
The apparent viscosity (mPa.s) of the samples was measured using an RV DV-II + Pro Brookfield® rotary viscometer (Brookfield Engineering Labs, Middleboro, MA, USA) with a SC4-21 spindle shaft equipped with a SC4-13RPY small sample adapter, and a MVS1Y Flag Impeller spindle coupled to a Brookfield TC-112P bath (Middleboro, MA, USA). Ten grams of sample were added to the equipment. The measurements were performed by applying 423 × g for two minutes at 10 ± 0.5 °C. The apparent viscosity was calculated using Rheocalc® software.
2.6. Phenolic compounds profile
The analyses of the individual phenolic compounds were performed using HPLC, as previously described by Alberti et al. (2014). The HPLC apparatus was a 2695 Alliance (Waters, Milford, MA, USA) with quaternary pump, auto-sampler, photodiode array detector PDA 2998 (Waters, Milford, MA, USA) and Symmetry C18 (4.6 × 150 mm, 3.5 mm) column (Waters). The samples (10 g) were lyophilised (LD 1500, Terroni, São Paulo, SP, Brazil) and solubilised in a solution of acetic acid (2.5%) and methanol (99.9%) (1:3 mL/mL). The samples were subsequently homogenised, centrifuged (8,160 g, 20 min at 4 °C) (HIMAC CR-GII, Hitachi, Japan), filtered through a 0.22 mm nylon syringe filter (Waters, Milford, MA, USA), and stored in vials for analysis. The runs were monitored at 280 nm (flavan-3-ols and dihydrochalcones), 320 nm (hydroxycinnamic acids) and 350 nm (flavonols). The identification and quantification of phenolic compounds were performed by comparing their retention time with those of standards, and by using analytical curves. The validation parameters of the identified compounds are: Gallic acid: Y = 24,519X − 29,541, R2: 0.998, LOD: 0.18 µg/mL, LOQ:0.57 µg/mL; Catechin: Y = 5,999X − 9,084, R2: 0.999, LOD: 0.19 µg/mL, LOQ: 0.33 µg/mL; Epicatechin: Y = 5,729X + 13,748, R2: 0.992, LOD: 0.27 µg/mL, LOQ: 0.99 µg/mL; Phloridzin: Y = 17,194X − 30,986, R2: 0.997, LOD: 0.09 µg/mL, LOQ: 0.30 µg/mL; Chlorogenic acid: Y = 25,239X − 13,321, R2: 0.997, LOD: 0.19 µg/mL, LOQ: 0.62 µg/mL; Caffeic acid: Y = 39,960X + 80,223, R2: 0.984, LOD: 0.13 µg/mL, LOQ: 0.44 µg/mL; p-coumaric acid: Y = 61,187X − 85,345, R2: 0.998, LOD: 0.03 µg/mL, LOQ: 0.09 µg/mL.
2.7. In vitro antioxidant activity
The DPPH scavenging activity was performed as described by Brand-Williams et al. (1995). The antiradical capacity was determined by the DPPH method. Trolox was used as the standard to prepare the analytical curve [DPPH = 2.77 × absorbance; R2 = 0.9934] (50–500 μmol/L). The ABTS method was performed according to Re et al. (1999). A standard curve using different concentrations of trolox (50–400 μmol/L) was prepared [ABTS = 4.30 × absorbance; R2 = 0.9974]. The antioxidant activity using the FRAP method was performed according to Benzie and Strain (1996) with minor modifications. An analytical curve [FRAP = 1,000 × absorbance; R2 = 0.9936] was obtained using different concentrations of trolox (100–1,000 μmol/L). The cupric reducing antioxidant capacity (CUPRAC) method was performed according to Apak et al. (2008). An analytical curve [CUPRAC = 3,333.33 × absorbance, R2 = 0.9969] was obtained using different concentrations of trolox (100–1,000 μmol/L). All experiments were performed in quadruplicate using a microplate reader (Epoch microplate spectrophotometer, Synergy-BioTek, Winooski, VT, USA).
2.8. Flash profile analysis
All samples were sensorially described by using Flash profile analysis following the method described by Dairou and Sieffermann (2002), nine volunteers, students and professsors of the Graduate Program in Food Science and Technology of State University of Ponta Grossa (UEPG, PR-Brazil), were selected according to their experience in descriptive sensory analysis and their availability to participate. The volunteers aged from 22 to 43 years old, being 5 female and 4 male. The tests were carried out in individual booths with white light. A quantity of 50 mL of sample was served at 11 ± 1 °C in transparent plastic cups (Copobras, Carmopolis, Brazil), in triplicate, and coded with three random digits. The Flash profile was applied in four sections. In the first section, after a brief description of the method and products to be tested, the evaluators were asked to individually generate a list of attributes for appearance, odour, flavour and residual flavour, which was complete enough to discriminate all the samples, avoiding hedonic terms. In the second session, the terms that were generated were collected and presented to the evaluators, who could choose the definitive list of attributes and then perform the evaluation by placing them in order; each attribute of the samples was ordered from the highest intensity to the lowest intensity. The third and fourth sessions were replicates of the ordination session (Montanuci et al., 2015).
2.9. Statistical analysis
The data were presented as mean and standard deviation. The differences between the samples were assessed by one-way ANOVA, followed by the Fisher’s LSD averages test. Principal component analysis (PCA) was the multivariate tool applied to separate the samples according to their response values. The statistical analyses were implemented using Statistica 13.3 software (TIBCO Software Inc., Palo Alto, CA, USA). The data from the Flash profile analysis were subjected to generalized procrustes analysis (GPA) and ANOVA in order to verify the discrimination potential and repeatability, and also to generate descriptive maps of the samples in the Idiogrid® version 2.4 software programme (Dairou and Sieffermann, 2002).
| 3. Results and discussion | ▴Top |
3.1. Profile of smoothie consumption
Five hundred volunteers participated in the online research; 74.8% lived in the south of Brazil and the remaining 25.2% were distributed among the other regions of the country. A total of 84.2% of the volunteers were female. The ages of the volunteers ranged from 13–65, and 74.2% were aged 19–35. A total of 52% of the participants were single, and 45.2% were married or in a stable relationship. A total of 48% had a monthly income of 4–10 minimum salaries (minimum salary corresponded to US $ 253.92); 36.8% received up to two minimum salaries; 12.2% received 11–20 minimum salaries; and 3% earned over twenty minimum salaries per month.
In this study, 93% of the volunteers did not follow a lifestyle that was influenced by the consumption of healthy foods, such as veganism. When the research participants were asked about the concept of smoothies, 32.2% answered that smoothies were “equal to a vitamin”; 25.2% said that they were “equal to a shake”, 12.4% said they were “a juice”; and 27.5% answered that they did not recognise any of the alternatives to describe a smoothie. Only 3% of the volunteers wrote a response about the concept of a smoothie and, of these, 0.4% wrote a response that was similar to the standard concept of smoothies used to evaluate the responses.
In Brazil, smoothies do not have a standard of identity and quality defined by legislation. Therefore, pre-defined concepts are generally based on the correlation that consumers are guided by experiences that they have already had with other beverages. In the case of the present study, the concept was associated with a “fruit vitamin”.
The participants who had most access to the consumption of smoothies were female, living in the south of Brazil, and who received 4–10 minimum salaries per month. This finding was similar to the results of a study in Ireland, where smoothies were most consumed by young females of high social class. The research agency Mintel reported that 74% of people who frequented smoothie bars in the USA were aged 18–24 (Mintel Group, 2015).
In our study, 62.4% of the participants indicated that the health factor was the main reason why they would consume smoothies, followed by 60% who highlighted the importance of flavour. A total of 19.6% of the participants stated that the appearance of a smoothie was important, and 15.2% indicated that they consumed smoothies to lose weight.
When questioned about why they did not consume smoothies, 83.1% of the volunteers reported that they had never had a chance to try a smoothie, followed by 12% who said that the reason was that their price was prohibitive. In countries where these products are most popular people tend to state that they do not consume smoothies because they prefer fresh fruit; due to a lack of habit; they dont like the consistency; or because they are too sweet or very expensive (Sijtsema et al., 2012).
In our study, the six most preferred fruits were strawberry (54.20%), banana (40.50%), pineapple (32.11%), grape (29.22%) and blueberry and passion fruit, both with 25.57%.
Therefore, a lack of knowledge about smoothies, their price, and the lack of evaluation of the characteristics expected by the consumers of smoothies can be limiting factors in terms of their consumption, making them unpopular and restricted to a small sector of the population, i.e. young, single women living in southern Brazil who are motivated to consume smoothies for health reasons and because of their flavour.
3.2. Characteristics of Brazilian smoothies
The smoothies were divided into yellow (30%), red (52.9%), green (11%) and white (5.9%) colours due to their main ingredients, namely, apple pulp (29%); banana pulp (17%); orange juice (17%) and kiwi fruit or pulp (12%), followed by other fruits such as mango, yellow fruits, red fruits, native fruits and açaí pulp (Table 1).
 Click to view | Table 1. List of coded smoothies with label specifications and characteristics. |
The weight or volume of the products ranged from 90 to 300 mL and was inversely correlated with their viscosity (> viscosity < volume/weight). A total of 82% of the samples were marketed in glass containers (250–300 mL). The period of validity of the smoothies ranged from 30 to 360 days. Three samples were in packages cheer pack, which allowed the pasteurisation of the product inside the package and extended the shelf life to 360 days. The price per litre or kilogram of the smoothies ranged from US$ 7.15 to 24.29 (Table 1). This price difference was related to the value of the fruit used in the formulation and also the processing technology used (Tiwari, 2018; Bevilacqua et al., 2018).
3.3. Physicochemical composition of smoothies
The soluble solids content varied from 10.13 to 18.03 degrees Brix (S8 and S13). All the samples presented fructose, sucrose and glucose, with a high variability between the lowest and highest values (Table 2). None of the samples reported the addition of sugars on the product label. However, the samples presented from two to seven fruits in different proportions in their formulations (Table 1).
Click to view | Table 2. Physical, chemical and instrumental characteristics of Brazilian smoothies. |
The pH ranged from 3.21 to 4.33, and acidity from 0.34 to 1.02 g/100mL (Table 2). The smoothie with the highest acidity (S11) contained apple, blackberry and raspberry pulp. The addition of berries to apple juice/pulp can increase the acidity by three-fold or more (Zielinski et al., 2014b).
Colour parameters contribute to the visual identity of a product; they are one of the first aspects to be evaluated by consumers and they can directly affect the decision to purchase (Medina-Meza et al., 2015). The highest values for saturation (C*) and colour tone (ho) were observed in the groups of yellow and green smoothies, respectively. The C* values ranged from 1.51 to 69.87 in the S13 and S4 samples, respectively, and the hue angle ranged from 15.44 to 84.52 in the S11 (blackberry with raspberry) and S6 (kiwi, pineapple and lemon) samples, respectively.
The lowest and highest values for apparent viscosity were in the S4 and S12 samples, respectively (Table 2). Viscosity stands out as an indicator of quality because it contributes considerably to the sensory perception and appreciation of beverages (Camacho et al., 2015).
The TPC ranged from 612 to 1,498 mg gallic acid equivalents (GAE)/L due to the different fruit mixtures (Table 3). The samples including cherries, apples and berries, such as raspberry, grape and açaí (S3, S8, S12 and S13, respectively), showed higher values for TPC. The carotenoids were most concentrated in the S1 and S4 samples, which were based on yellow fruits (Table 3), with an emphasis on the S1 sample, which was based on mango and orange.
Click to view | Table 3. Bioactive compounds and antioxidant activity in Brazilian smoothies. |
The S3 sample (acerola with papaya) showed the highest results for ascorbic acid, DPPH, FRAP and ABTS. Acerola pulp can contain between 300 and 4,600 mg of vitamin C/100g (Vendramini and Trugo, 2000) and it also contains phenolic compounds, especially cyanidin 3-rhamnoside and quercetin 3-rhamnoside (Mezadri et al., 2008). Thus, the antioxidant activity of acerola pulp can increase antioxidant activity eight times more than other fruit pulps (Müller et al., 2010). The carotenoids present in papaya can also increase antioxidant activity as it has a significant content of beta-carotene, beta-cryptoxanthin and lycopene, which are known to be potent antioxidants (Rodriguez-Amaya, 2001).
Chlorogenic acid was present in all the samples and phloridzin was found in 15 of the 17 samples (Table 4). The presence of phloridzin confirmed the presence of apple in the formulation of most of the smoothies (Table 1) (Herrera-Alvarez et al., 2017). The S12 sample (apple and banana) presented the highest values for epicatechin, phloridzin, chlorogenic acid and caffeic acid, as well as high antioxidant activity for ABTS and CUPRAC (Table 3). This sample contained added ascorbic acid, which may have influenced the antioxidant activity.
Click to view | Table 4. Individual phenolic compounds (mg/L) analyzed in Brazilian smoothies. |
All the data that were obtained regarding the chemical composition of the smoothies were analysed by multivariate analysis. Principal component analysis (PCA) was performed. Factor 1 explained up to 23.19% of total variance and Factor 2 explained up to 18.09%, totalling 41.28% of total variance (Fig. 1a). Seven samples (S2, S5, S6, S7, S9, S10 and S12) presented similarity, despite containing different ingredients because two were based on yellow fruits; two were based on green fruits, and three were based on red fruits.
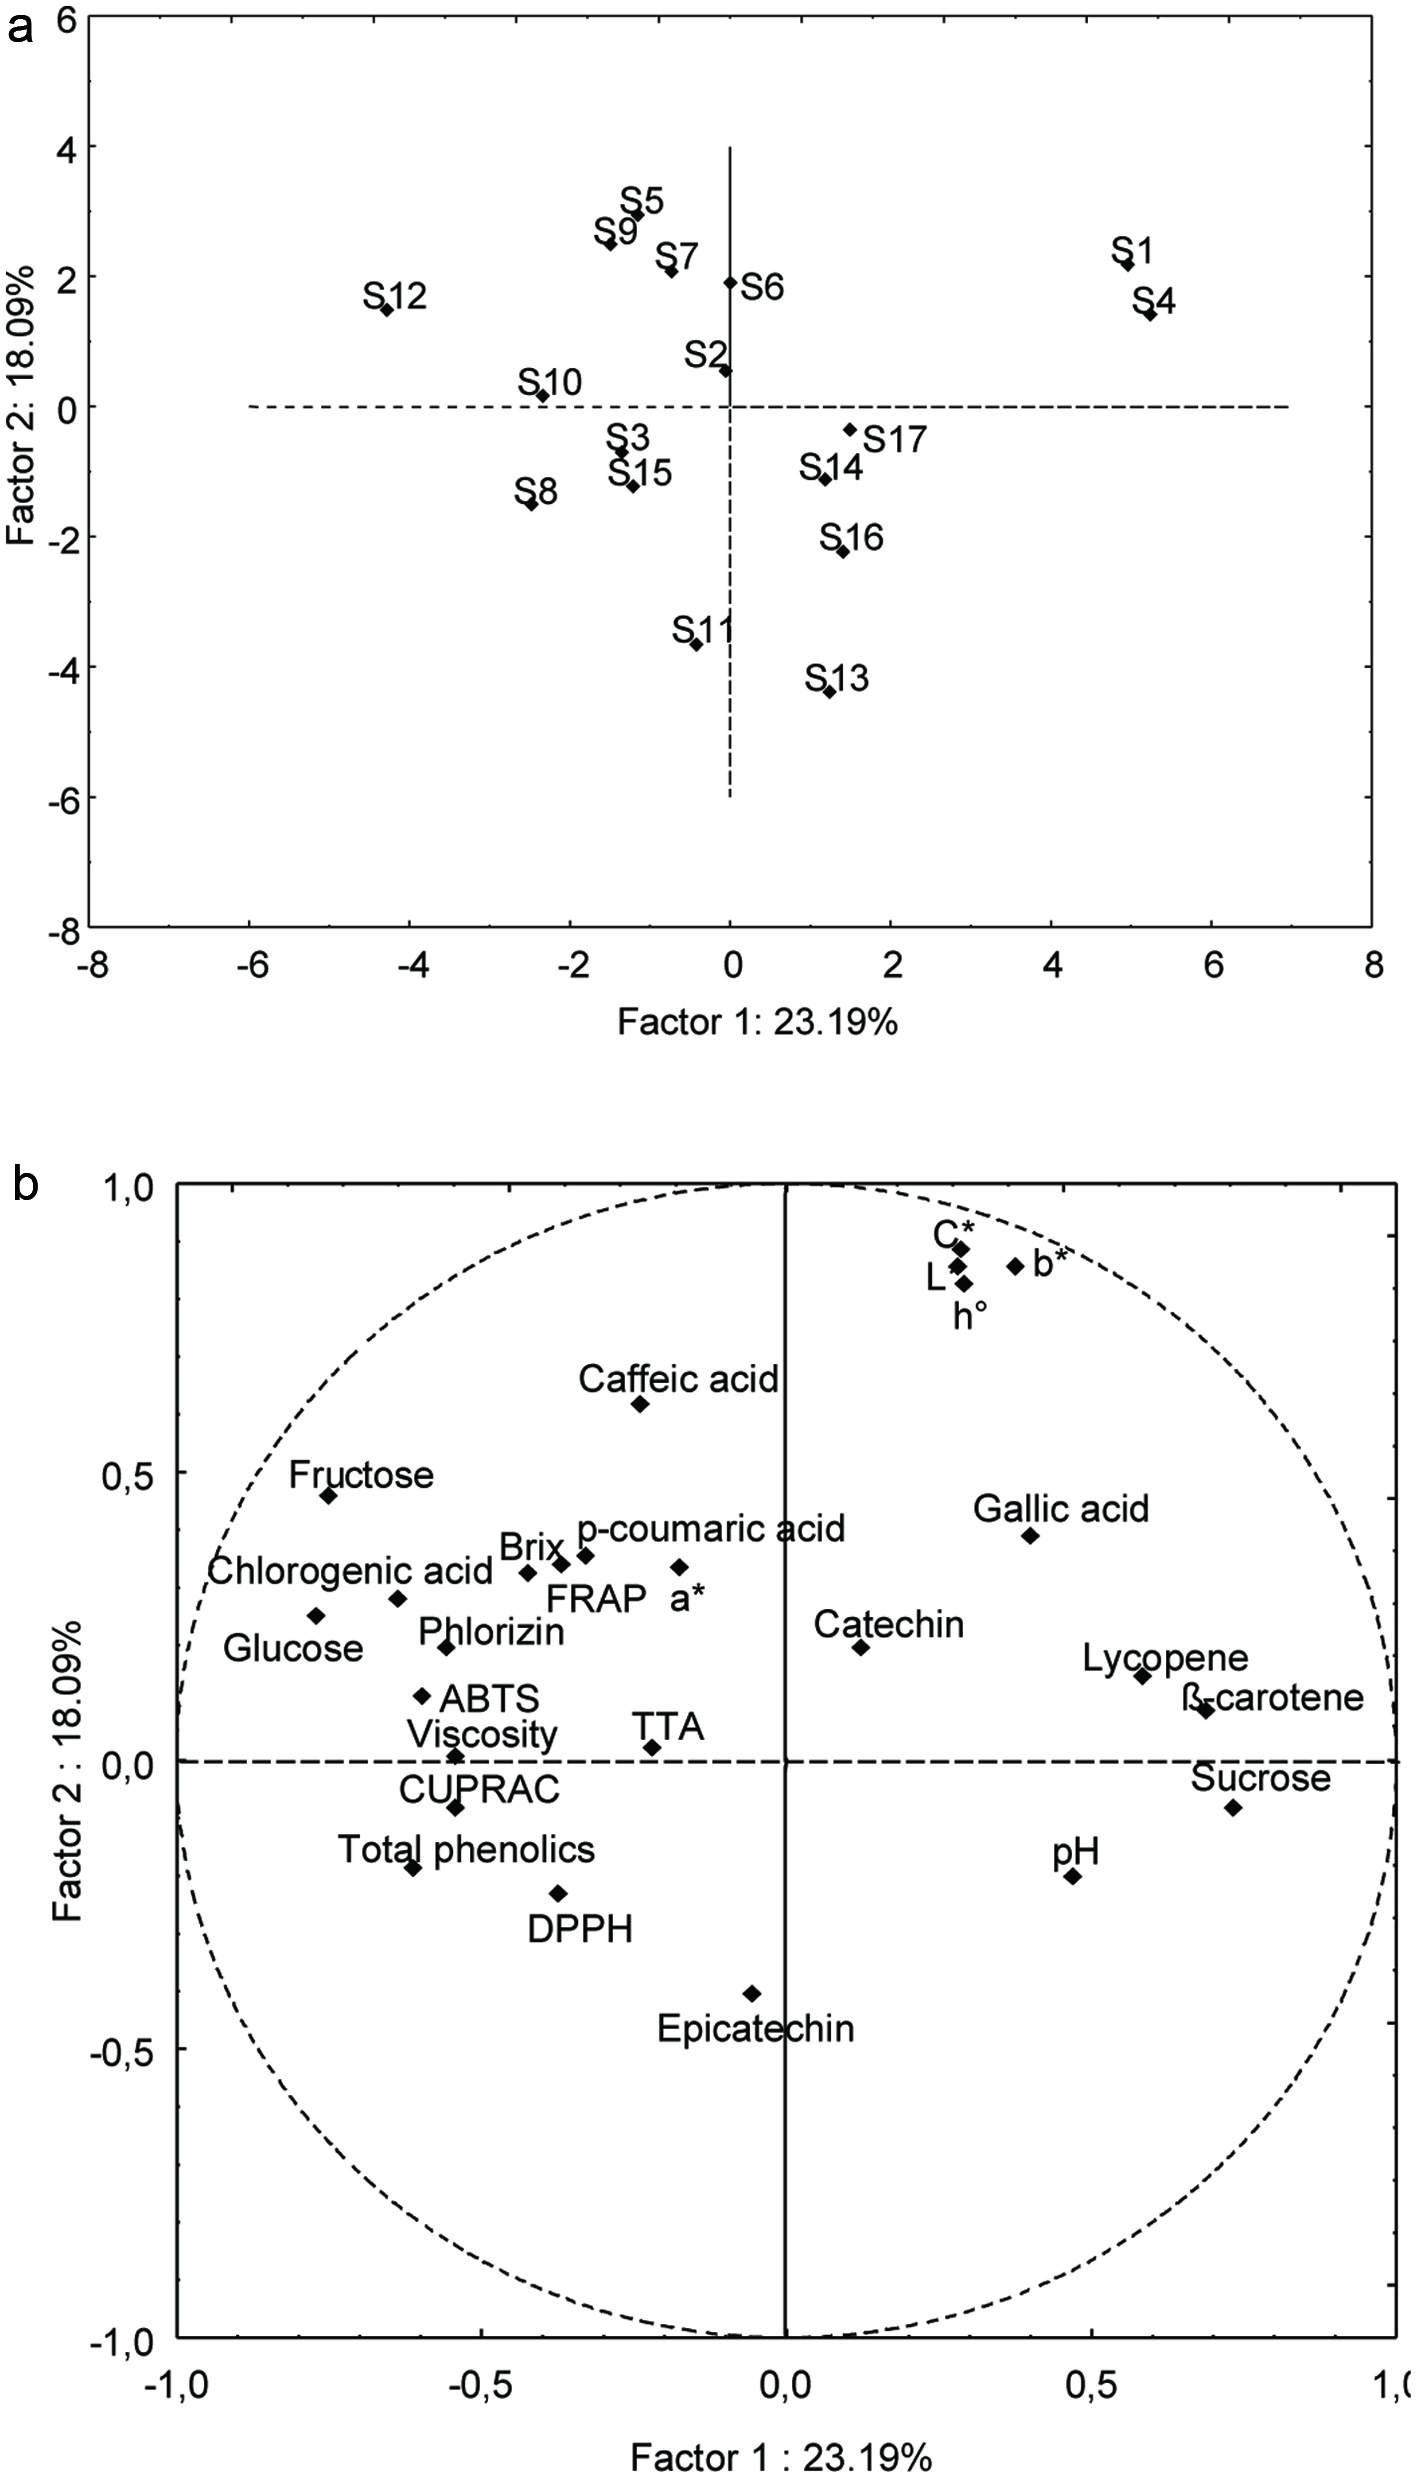 Click for large image | Figure 1. 2-D scatter plot of the Brazilian commercial smoothies (a) and their respective correlated variables (b). |
The set of characteristics used to correlate these samples were the glucose and fructose content, brix, viscosity, a*, FRAP and ABTS analyses, and the similarity in the presence of caffeic acid, p-coumaric acid, chlorogenic acid and phloridzin in the samples. The only common ingredient among these seven samples was apple, in the form of concentrated juice or pulp. This may explain some of the similar characteristics shared by these samples. Due to their fructose content and low cost, apples can be used in beverages to correct acidity and provide a sweet taste. In the form of pulp, they may also contribute to viscosity. Beverages containing chlorogenic acid, catechins, epicatechins, cyanidines, quercitins, rutins and phloridzin have increased levels of antioxidant activity (Zardo et al., 2013).
The S13, S14 and S16 samples least resembled the other samples. They all contained banana and red fruits, which may explain the presence of sucrose and low pH values. The similarity between samples S1 and S4 was influenced by their carotenoid, catechin and gallic acid content, as well as their colour parameters (Fig. 1a and b). The total phenol content, epicatechin content, and antioxidant activity by CUPRAC and DPPH, characterised the group that contained samples S3, S8, S11 and S15.
3.4. Sensorial description of Brazilian smoothies
Generalized procrustes analysis, which approximates results, and generates average positions for attributes, allowed us to obtain the results presented in Figure 2. The accumulated variance between F1 and F2 was 52.42%. Samples located in the same quadrant were considered similar. The samples in the upper and lower left quadrant of the figure, which were S2, S8, S12, S13, S15, S16 and S17, had in common the characteristics of a residual and acid taste, vivacity and intensity of the colour, a fruity, citrus and herbal odour, a herbal flavour, as well as a fibrous and bitter residue (Fig. 2). These characteristics were correlated with preference and attractiveness by the evaluators. All these samples contained banana (except S8) and six of them had some red fruit in their composition such as açaí, raspberry, strawberry or grape (Table 1). The S1, S4, S9 and S14 samples were described as viscous, turbid and bitter-tasting, and two of them contained mango as a common ingredient. The S3, S5, S6, S7, S10 and S11 samples were described as homogeneous, with an artificial and fruity flavour, a sweet residual taste, a sweet taste, and an artificial and intense odour. Most of these samples contained fruits classified as acid and/or astringent such as acerola, kiwi, lemon and blackberry.
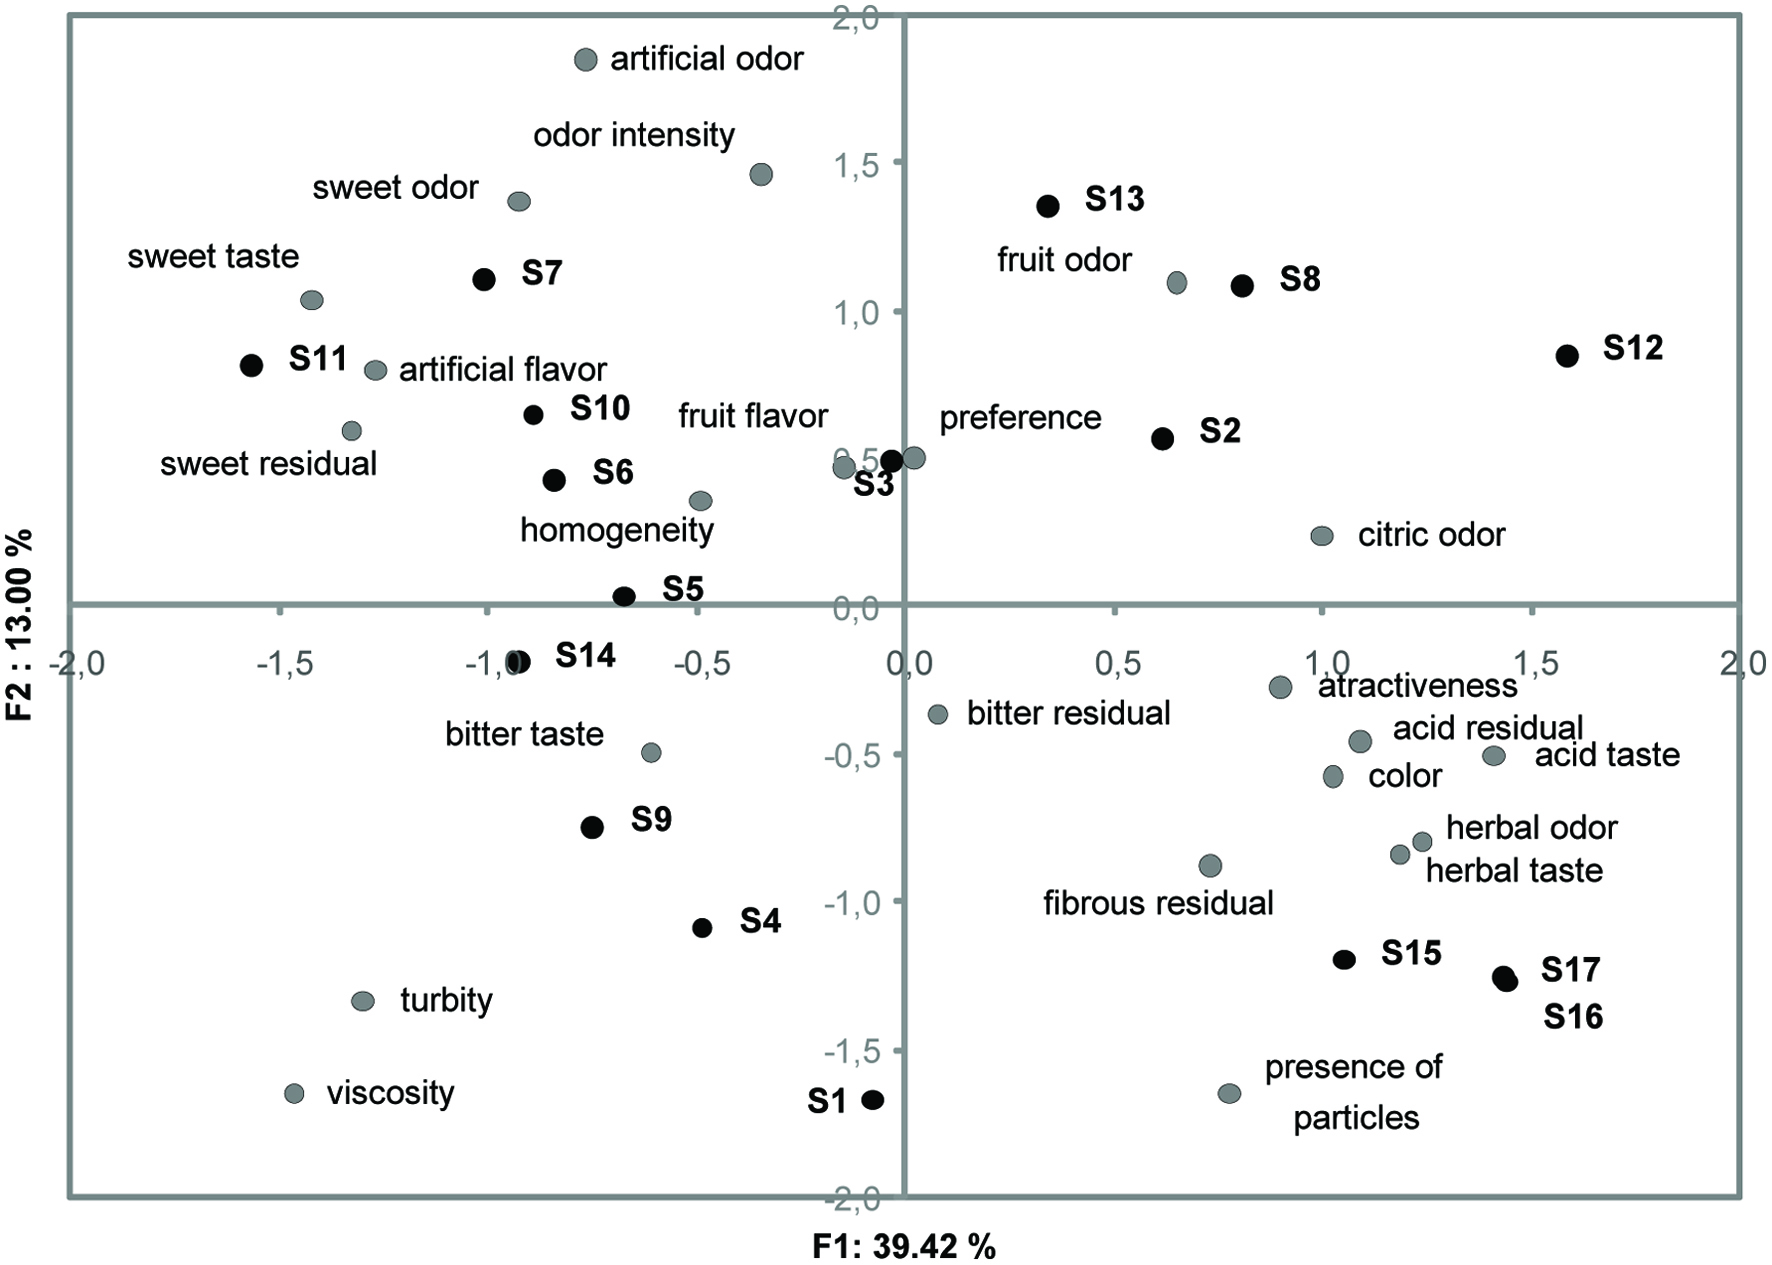 Click for large image | Figure 2. Result of the sensory analysis applied to Brazilian commercial smoothies by generalized procrustes analysis (GPA). |
The S12 sample can be highlighted because it was the closest to the characteristics of consumers’ preference, and also had high antioxidant activity. The category of fruit juices is currently under strong pressure to reduce sugar content. The S3 sample, which despite its low sugar content had a high content of beta carotene, catechin, total phenols and high antioxidant activity, was not a preferred flavour (acerola and papaya) in the online survey. Nowicka and Wojdylo (2016) studied different formulations with added ingredients that made smoothies more interesting from the nutritional point of view. They found a higher rejection rate by the tasters in the sensory analysis in their study. In view of these results, the challenge to develop a product with the sensorial, nutritional and functional characteristics desired by consumers remains difficult.
| 4. Conclusions | ▴Top |
The pattern of consumption of smoothies in Brazil can be described as being the preference of young women, students, single women living in the southern region of Brazil, who consume smoothies for health reasons and also because of their flavour. An important limiting factor in the consumption of smoothies in Brazil may be a lack of knowledge about this beverage.
Although the physicochemical characteristics were quite distinct, due to the variety of formulations, it was possible to generate common descriptive terms for the smoothies. These were related to the flavour (artificial, fruity and herbal), residual taste (acidic, bitter, sweet and fibrous), taste (acid and sweet), odour (artificial, citric, sweet, fruity and herbal) odour intensity, colour intensity, presence of particles, homogeneity, turbidity and viscosity. The Brazilian smoothies presented from two to seven fruits in different proportions in their formulations. These mixtures influenced the antioxidant activity values, mainly in the FRAP method, with difference of 11 times. The samples containing cherry, apple, raspberry, grape and açaí, showed higher values for TPC. Smoothies with acerola and papaya showed the highest results for ascorbic acid, beta-carotene, lycopene and antioxidant activity by DPPH, FRAP and ABTS method. Chlorogenic acid, phloridzin, caffeic acid and p-coumaric acid were present in almost all the samples, indicating the presence of apple in the formulation of most of the smoothies.
This study allowed us to conclude that the existing products available in the Brazilian market are not shaped by consumer expectations, possibly because they have not been formulated based on information collected from the population. Designing a moulded product with the information presented in this study can increase the chances of raising the consumption of this beverage by the public and also attract new consumers.
Acknowledgments
This work was supported by the National Council for Scientific and Technological Development (CNPq) under Grant [#303789/2016-6] and Coordenação de Aperfeiçoamento de Pessoal de Nível Superior - Brasil (CAPES) under Grant [Finance Code 001].
| References | ▴Top |