| Journal of Food Bioactives, ISSN 2637-8752 print, 2637-8779 online |
| Journal website www.isnff-jfb.com |
Original Research
Volume 8, December 2019, pages 51-57
Differentiation between aroma-related bioactives in native cold-pressed rapeseed oils with desired sensory attributes and with a fusty/musty off-flavor using multivariate methods
Kathrin Matheisa, Michael Granvogla, b, *
aLehrstuhl für Lebensmittelchemie, Technische Universität München, Wissenschaftszentrum Weihenstephan für Ernährung, Landnutzung und Umwelt, Lise-Meitner-Straße 34, D-85354 Freising, Germany
bInstitut für Lebensmittelchemie, Fg. Lebensmittelchemie und Analytische Chemie (170a), Universität Hohenheim, Fakultät Naturwissenschaften, Garbenstraße 28, D-70599 Stuttgart, Germany
*Corresponding author: Michael Granvogl, Institut für Lebensmittelchemie, Fg. Lebensmittelchemie und Analytische Chemie (170a), Universität Hohenheim, Fakultät Naturwissenschaften, Garbenstraße 28, D-70599 Stuttgart, Germany. Tel: +49 711 459 23979; Fax: +49 711 459 24096; E-mail: michael.granvogl@uni-hohenheim.de
DOI: 10.31665/JFB.2019.8206
Received: November 1, 2019
Revised received & accepted: November 19, 2019
| Abstract | ▴Top |
A systematic quantitation of selected odorants using stable isotope dilution analysis (SIDA) was performed in six native cold-pressed rapeseed oils with desired retention of bioactives and desired sensorial attributes (“positive controls”, PCs), in nine native cold-pressed rapeseed oils eliciting a fusty/musty off-flavor (OFs), and in two rapeseed samples, from which two of the nine fusty/musty OFs were pressed. These data were used as basis to find marker compounds for the fusty/musty off-flavor by means of multivariate methods. Obtained data clustered pairwise in a heatmap clearly showed that all PCs and OFs were very similar to each other in their own group concerning the selected compounds, but different to each other. Additionally, data were statistically evaluated using principal component analysis (PCA). Based on selected compounds, a high accordance of PCs, in parallel to a clear discrimination to the group of fusty/musty OFs and to the two rapeseed samples, was achieved. In a biplot, compounds with the highest differences between the two oil groups were identified as 4-methylphenol, 3-methylbutanoic acid, 2-phenylethanol, 2-ethyl-3,6-dimethylpyrazine, and 2-methylbutanoic acid. Thus, these compounds can be seen as marker compounds for the fusty/musty OFs and the seeds and can, therefore, serve for quality control of the raw material within a quick routine method.
Keywords: Rapeseed oil; Off-flavor; Marker compounds; Stable isotope dilution analysis; Principle component analysis; Heatmap
| 1. Introduction | ▴Top |
Refined rapeseed oil is one of the top-ranked consumed edible oils worldwide in the past years, only behind palm oil and soybean oil (United States Department of Agriculture, 2016). One of the reasons for the high consumption is the beneficial health aspect, which is mostly related to the fatty acid composition with an average content of only 6% and 2% of the saturated fatty acids, palmitic acid and stearic acid, but with 58% of oleic acid, 20% of linoleic acid, and especially 8% of linolenic acid. Based on this, rapeseed oil facilitates that the observing of several recommendations given by different organizations can be fulfilled, e.g., an energy intake based on saturated fatty acids of < 10% recommended by the FAO/WHO expert group to lower the risk of cardiovascular diseases or the ratio of 5:1 of ω6-fatty acids to ω3-fatty acids recommended by the German Nutrition Society (Deutsche Gesellschaft für Ernährung e. V.; DGE). The latter is based on the fact that the general fat intake of an average consumer ends up with a ratio of 8:1 of ω6- to ω3-fatty acids, so that in combination with the ratio of 2.5:1 of ω6- to ω3-fatty acids present in rapeseed oil, the recommended average ratio of 5:1 can be achieved. Beside the positive nutritional aspects, native cold-pressed rapeseed oil is gaining more and more popularity because of its retention of minor bioactive compounds and the characteristic nutty and cabbage-/asparagus-like odor impression, which is lost in refined rapeseed oils during the refinery process. However, due to deficient storage conditions, a fusty/musty off-flavor is widespread (Matthäus and Brühl, 2008) and causes economic damage. Nowadays, the aroma is one of the most important criteria for consumers to (re-)buy a certain type of food. Thereby, the overall aroma of a food is characterized by only a small set of bioactive volatiles within hundreds, sometimes up to > 1,000 volatiles. These aroma-active volatiles are called key odorants and are defined by an odor activity value (OAV = ratio of the concentration of an odorant divided by its corresponding odor threshold) ≥ 1. First, Pollner and Schieberle (2016) applied the sensomics concept to native rapeseed oils to unravel aroma differences of rapeseed oils pressed from peeled and unpeeled seeds. In parallel, Matheis and Granvogl (2016) used the molecular sensory science concept to characterize the key odorants of native cold-pressed rapeseed oils eliciting the desired sensory attributes (“positive controls”; PCs) in comparison to a rapeseed oil with a fusty/musty off-flavor (OF). Thereby, main differences between PC and OF were found for 16 compounds, which increased in OF at least by a factor of five. The highest ratios between concentrations in OF and PC were determined for 2-methylbutanoic acid (factor of 11500), 2-methoxyphenol (780), ethyl 2-methylbutanoate (430), dimethyl trisulfide (81), 2-ethyl-3,5-dimethylpyrazine (38), 2-acetylpyridine (36), 2-ethyl-3,6-dimethylpyrazine (36), 3-hydroxy-4,5-dimethylfuran-2(5H)-one (29), acetylpyrazine (21), 2-isobutyl-3-methoxypyrazine (20), 2-methylbutanal (20), and 3-methylbutanoic acid (19). Additionally, the seed, from which OF was pressed (OFS), was subjected to both sensorial and instrumental analyses to check the influence of the pressing procedure on the off-flavor formation. Due to the fact that exactly the same 18 odorants in OF and OFS showed OAVs ≥ 1, only differing in the respective concentrations, the pressing process was excluded as main reason for the formation of this distinct off-flavor. To prove, that the identified and quantitated odorants are characteristic for rapeseed oils with a fusty/musty off-flavor (and not only for this single sample), seven further oils evoking the same off-flavor were investigated and confirmed the previously obtained data (Matheis and Granvogl, 2016). However, an investigation of further native cold-pressed rapeseed oils with desired sensorial attributes for an additional confirmation of this assumption is still lacking.
Thus, in this study, five further rapeseed oils with the typical nutty and cabbage-like attributes were analyzed to verify previous findings. Further, the complete data set should statistically be evaluated using multivariate analysis (principal component analysis).
| 2. Materials and methods | ▴Top |
2.1. Oil samples
The native cold-pressed rapeseed oils with desired sensory attributes were purchased from commercial suppliers (“positive controls”, PCs). The off-flavor rapeseed oils were manually pressed by Max Rubner-Institut (Detmold, Germany) from rapeseed samples provided by an oil mill or delivered by the oil mills to have exact information about the origin of the oils.
2.2. Chemicals
The following reference compounds for identification and quantitation experiments were obtained from commercial sources: acetylpyrazine, 2-sec-butyl-3-methoxypyrazine, ethyl 3,5-dimethylpyrazine, ethyl 3,6-dimethylpyrazine, ethyl 2-methylbutanoate, 3-hydroxy-4,5-dimethylfuran-2(5H)-one, 2-isobutyl-3-methoxypyrazine, 2-isopropyl-3-methoxypyrazine, 2-methoxyphenol, 3-methylbutanal, 2-methylbutanoic acid, 3-methylbutanoic acid, 4-methylphenol, and 2-phenylethanol (Aldrich; Sigma-Aldrich, Taufkirchen, Germany); 2-acetylpyridine, butanoic acid, and 4-hydroxy-2,5-dimethylfuran-3(2H)-one (Fluka, Neu-Ulm, Germany); 2-methylbutanal (Lancaster, Mühlheim/Main, Germany); and dimethyl trisulfide (Acros Organics, Geel, Belgium).
The following chemicals were commercially obtained: liquid nitrogen (Linde, Munich, Germany); acetone, dichloromethane, diethyl ether, ethanol, sodium hydrogen sulfate, and anhydrous sodium sulfate (Merck, Darmstadt, Germany); argon, helium, hydrogen, and nitrogen (Westfalen, Münster, Germany). Dichloromethane and diethyl ether were freshly distilled prior to use. All chemicals were at least of analytical grade.
2.3. Stable isotopically labeled standards
[2H7]-4-Methylphenol (C/D/N Isotopes, Quebec, Canada) was commercially obtained.
The following stable isotopically labeled compounds were synthesized as previously described: [2H3]-acetylpyrazine (Schieberle and Grosch, 1987); [2H2]-butanoic acid (Schieberle et al., 1993); [2H3]-2-sec-butyl-3-methoxypyrazine analogue to 2-isobutyl-3-methoxypyrazine (Semmelroch and Grosch, 1996); [2H6]-dimethyl trisulfide (Milo and Grosch, 1996); [2H3]-2-ethyl-3,5-dimethylpyrazine (Cerny and Grosch, 1993); [2H3]-ethyl 2-methylbutanoate (Guth and Grosch, 1993); [13C2]-3-hydroxy-4,5-dimethylfuran-2(5H)-one (Blank et al., 1993); [2H3]-2-isobutyl-3-methoxypyrazine and [2H3]-2-isopropyl-3-methoxypyrazine (Semmelroch and Grosch, 1996); [2H3]-2-methoxyphenol (Cerny and Grosch, 1993); [2H2]-2-methylbutanal and [2H2]-3-methylbutanal (Granvogl et al., 2012); [2H9]-2-methylbutanoic acid analogue to [2H2]-3-methylbutanoic acid (Guth and Grosch, 1994); and [2H5]-2-phenylethanol (Gassenmeier and Schieberle, 1995).
2.4. Quantitation by high-resolution gas chromatography-mass spectrometry (HRGC-MS) and two-dimensional high-resolution gas chromatography-mass spectrometry (HRGC/HRGC-MS) via stable isotope dilution analysis (SIDA)
The stable isotopically labeled standards (0.5–5 μg; dissolved in dichloromethane or diethyl ether; amounts depending on the concentrations of the respective analytes determined in a preliminary experiment) were added either to the oil samples (5−100 g) or to the rapeseed samples (5−50 g) and the mixture was stirred for 15 min at room temperature for equilibration. Then, the mixture was diluted with diethyl ether (20 mL for the oils and 25−100 mL for the seed) and the volatiles were separated from the non-volatiles by means of thin-film distillation followed by high vacuum distillation using the solvent assisted flavor evaporation (SAFE) technique (Engel et al., 1999). After distilling off the solvent using a Vigreux column (50 cm x 1 cm), the concentrate (100 μL) was used for HRGC-MS or HRGC/HRGC-MS as recently described (Matheis and Granvogl, 2016).
2.5. Determination of orthonasal odor thresholds (OTs)
Determination of OTs was performed as previously reported (Czerny et al., 2008).
2.6. Multivariate analysis-heatmap
The statistical computing and graphics were performed using R as programming language (R Development Core Team R, 2017; version 3.4.1; Boston, MA, USA) in combination with Rstudio (RStudio Team, 2016; version 1.0.143; Boston, MA, USA). For every single analyte, the logarithmized concentration was scaled over all samples and the mean values and standard deviations of the complete data set were considered. The obtained z-scores were visualized in a heatmap using “pheatmap” in R Package (version 1.0.8), developed by Kolde. The samples were clustered using an agglomerative algorithm based on criteria according to Ward (Murtagh and Legendre, 2014) and Euclidean distance.
| 3. Results and discussion | ▴Top |
To prove the assumption that the odorants, which were present in increased (compared to PCs) concentrations in fusty/musty off-flavor oils and, thus, were hold generally responsible for a fusty/musty off-flavor formation in rapeseed oils (Matheis and Granvogl, 2016), the absence of these compounds or their presence in rather low concentrations in a broader set of native-cold pressed rapeseed oils with desired sensorial attributes were tested. Therefore, the same 17 compounds, already investigated in several off-flavor oils, were quantitated in five rapeseed oils eliciting the desired aroma attributes (PC1-5) and were compared to the data of the off-flavor oils as well as to the data obtained for the sole positive control oil sample in the previous study (Matheis and Granvogl, 2016).
In general, only for some compounds, slight differences in the odorant concentrations between PC and PC1-5 were noticed. Clearly increased amounts were only determined for 2-methylbutanoic acid (in PC1-5) and for 2-isobutyl-3-methoxypyrazine (except of PC3) (Table 1). The small differences between the odorant concentrations in PC1-5 are commonly natural deviations due to differences in variety, climatic conditions, or time of harvest.
 Click to view | Table 1. Concentrations of 17 selected odorants in the positive control (PC) and further five native cold-pressed rapeseed oils eliciting the desired sensory attributes (PC1-PC5) |
Thus, these data proved that based on the analyzed odorants, PC1-5 showed high similarities to previously investigated PC. Combining the low concentrations of aroma-active compounds no. 1–10 (cf. Tables 1 and 2) in PC and PC1-5 and their high amounts in OF and OF1-8, these compounds could clearly be corroborated as suitable marker compounds for the fusty/musty off-flavor.
Click to view | Table 2. Concentrations of 17 selected odorants in the positive control (PC), off-flavor oil (OF), further seven native cold-pressed rapeseed oils eliciting a fusty/musty off-flavor (OF1-OF7), and rapeseed sample, from which OF8 was pressed (OFS8) |
3.1. Clustering in a heatmap
For visualization, all quantitative data (Tables 1 and 2) were clustered in a heatmap (Figure 1). Therefore, the data are represented in a two-dimensional matrix showing the concentrations in different color gradations. Pairwise clustering is performed by permuting the rows and columns according to similarity. The complex hierarchical relations between variables (samples and analytes) are displayed as dendrogram in the periphery of the graph. Low concentrations are displayed in white and light yellow, increasing concentrations are illustrated in yellow-orange to red, representing concentrations ranging from 0–1,000 µg/kg.
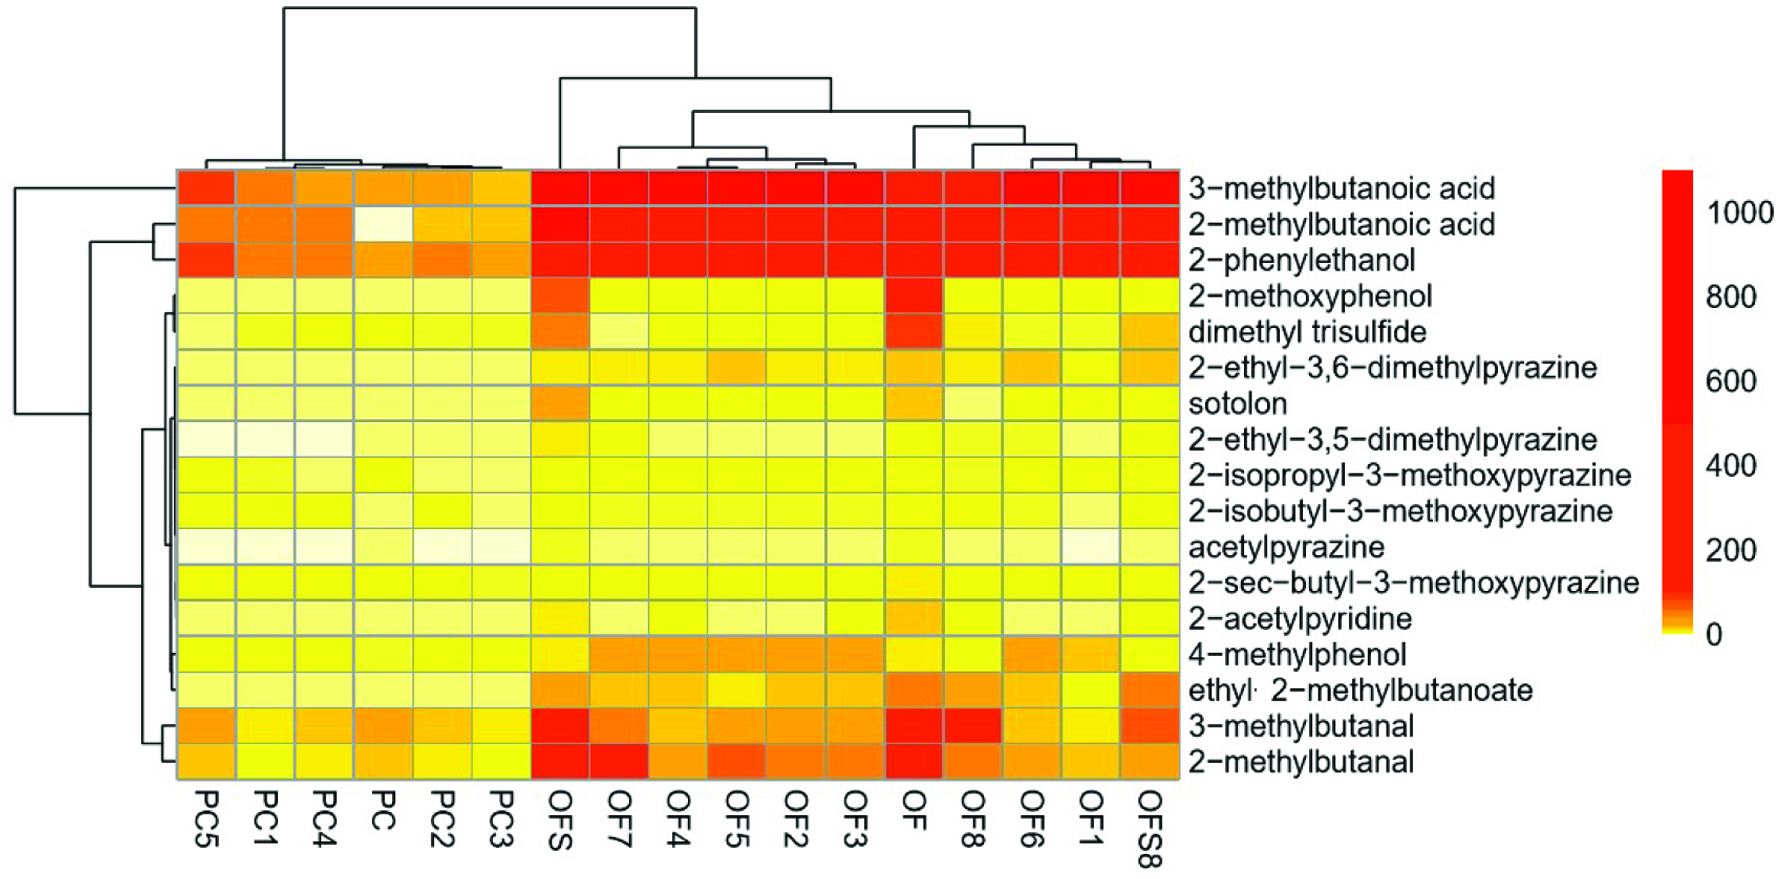 Click for large image | Figure 1. Heatmap, illustrating the clustering of oil samples with desired sensory attributes (PC and PC1-5) or a fusty/musty off-flavor (OF and OF1-8) as well as two corresponding rapeseed samples (OFS and OFS8), from which OF and OF8 were pressed. Concentrations (µg/kg) are displayed in colors with the lowest in white and the highest in red. |
The heatmap nicely clusters all native cold-pressed rapeseed oils eliciting the desired attributes (PC, PC1-5) on the left side of the plot, while on the right side all native cold-pressed rapeseed oils, with slightly differing but distinct fusty/musty off-flavors (OF, OF1-8; evaluated by a trained sensory panel), and the seed samples, from which OF and OF8 were pressed (OFS, OFS8), are displayed. The color code reflects the pronounced differences between PC/PC1-5 and OF/OF1-8 on the one side, and high similarities between the odorant concentrations in the oils OF and OF8 to the corresponding seeds OFS and OFS8 on the other side (Figure 1). The last aspect is of high interest for the manufacturer due to the fact that this data showed that already the quality of the seed samples, which is corresponding to the odorant concentrations, is determining the quality of the final oil.
In more detail, a clear increase of 2- and 3-methylbutanoic acid, 2-phenylethanol, 2-methoxyphenol, 2-ethyl-3,6-dimethylpyrazine, 4-methylphenol, ethyl-2-methylbutanoate was noticed for all off-flavor oils (OF, OF1-8) and the corresponding seed samples (OFS, OFS8) in comparison to the positive controls (PC, PC1-5). With this enlarged set of samples used for comprehensive aroma analysis on the basis of the molecular sensory science concept, the determination of marker compounds was achieved.
3.2. Principal component analysis (PCA)
PCA is a tool to reduce a large amount of data (variables) to a smaller set still containing most information of the original dataset by orthogonal transformation. The multidimensional data are arranged according to their variance and significance by transformation of the coordinate system. By this reduction, relevant variances between large datasets can be extracted and classified.
Thus, a PCA was performed based on the concentrations obtained for 17 aroma compounds in 15 native cold-pressed rapeseed oils (PC, PC1-5, OF, and OF1-8) and two rapeseed samples (OFS, OFS8). In the scoreplot, a clear discrimination between the group of the fusty/musty off-flavor oils (blue) and the group of oils eliciting the desired aroma attributes (red) was achieved (Figure 2). PC and PC1-5 are grouped in the upper quadrant of the left bottom and are, therefore, very similar to each other concerning principal component 1 and 2, which represent 86.2% of variance. OF and OF1-8 show a wider distribution based on the fact that these samples all elicited a fusty/musty off-flavor, but with slightly pronounced sensorial differences. Compared to the red colored samples, all blue samples are shifted to the right, proving a clear difference between PC-samples and OF-samples in principal component 1, which represents the largest possible variance. OF and OF8 as well as OFS and OFS8 showed a clearer difference to the PC-samples in principal component 1 than the other off-flavor samples, while OF8 and OFS8 do not show a shift in principal component 2.
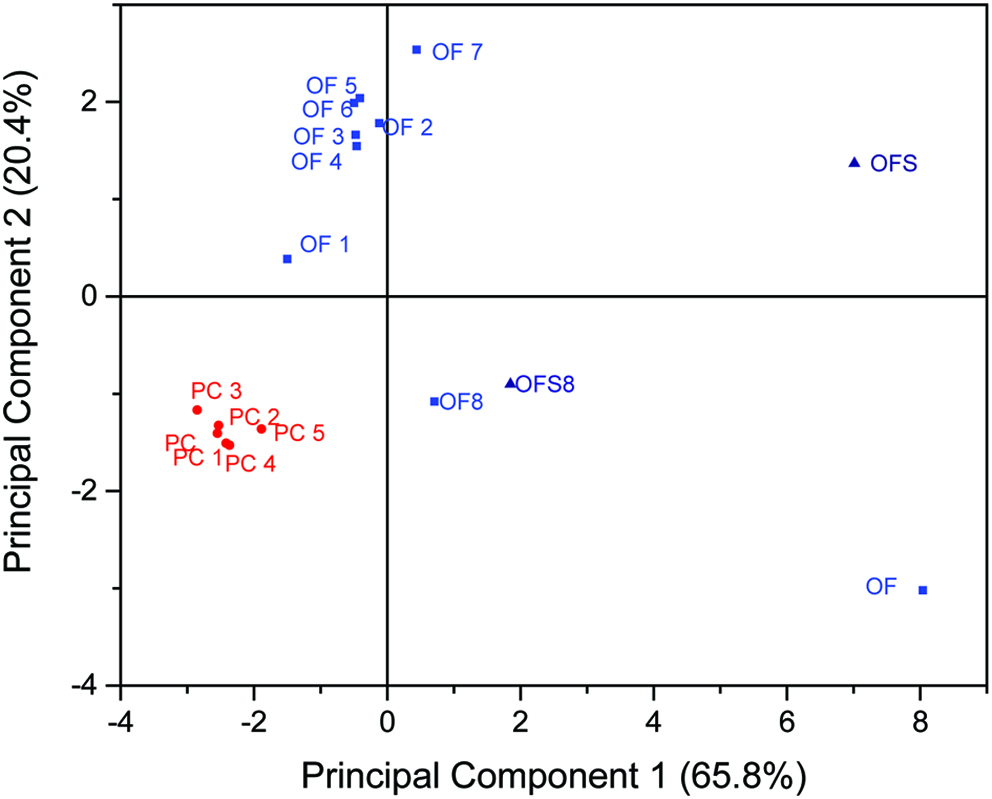 Click for large image | Figure 2. Scoreplot of the PCA, showing a clear discrimination of the group of oil samples with desired sensory attributes (PC and PC1-5) from the group of fusty/musty off-flavor oil samples (OF and OF1-8) as well as two corresponding rapeseed samples (OFS and OFS8), from which OF and OF8 were pressed. |
In addition to the scoreplot, the biplot displays the compositions of principal component 1 and 2 (Figure 3). All compounds showing a clear concentration increase in OF-samples compared to PC-samples are in the positive area of principal 1 (65.8% variance). Due to the fact that these compounds are only present in very low concentrations in the PC-samples, they are located in the negative area of principal component 1. Thus, the PC-samples are not characterized by these compounds. OF and OFS are in the most positive area of principal component 1, illustrating that the aroma compounds are present in highest concentrations in these samples, in parallel with a discrimination in regard to the principal component 2 (20.4% variance). The positive area of principal component 2 is described by the presence of 4-methylphenol, 3-methylbutanoic acid, 2-phenylethanol, 2-ethyl-3,6-dimethylpyrazine, and 2-methylbutanoic acid. Consequently, these compounds are present in higher concentrations in OF1-7 than in PC-samples. OF is located in the right quadrant on the bottom of the plot due to the clearly higher concentrations of 2-isobutyl-3-methoxypyrazine and 2-methoxyphenol compared to all other investigated samples. In summary, all OF-samples showed a significantly higher variance than PC-samples, which can be traced back to slight differences in the fusty/musty aroma profile as already mentioned above. Thus, the compounds, which had the highest influence on the discrimination between PC-samples and OF-samples, are in the right quadrant on the top of the plot and are suitable marker compounds. Thereby, it is noteworthy that a differentiation between analytical marker compounds, e.g., 2-phenylethanol and 2-ethyl-3,6-dimethylpyrazine, which are present at concentrations below their respective orthonasal odor thresholds, and thus, do not contribute to the overall off-flavor on the one hand, and sensory marker compounds, e.g., 2- and 3-methylbutanoic acid and 4-methylphenol, which were present at amounts clearly above their respective odor thresholds, ending up with OAVs > 1 and consequently contributing to the off-flavor on the other hand, should be made.
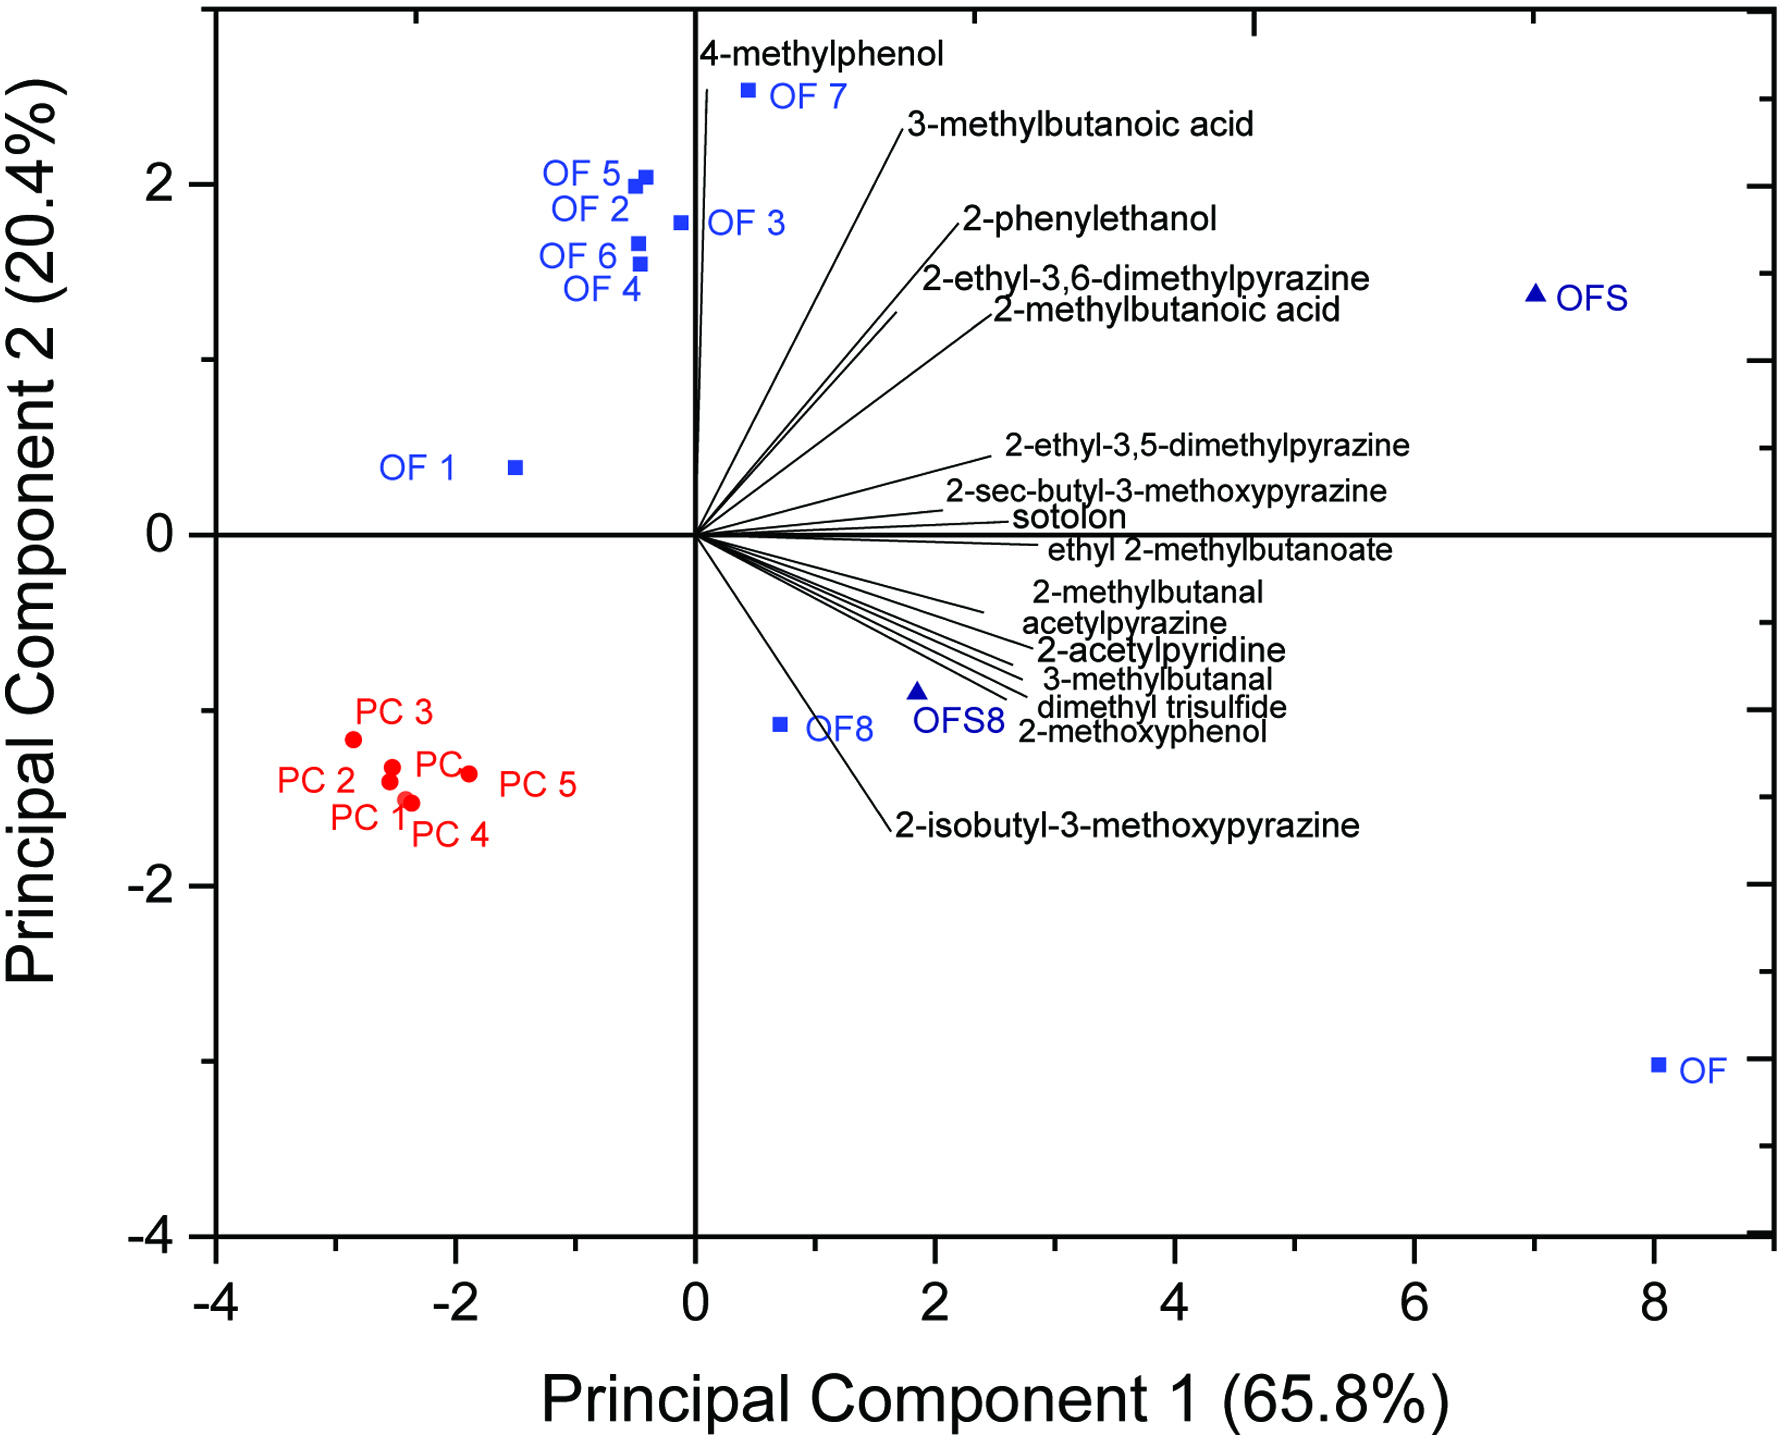 Click for large image | Figure 3. Biplot of the PCA, showing a clear discrimination of the group of oil samples with desired sensory attributes (PC and PC1-5) from the group of fusty/musty off-flavor oil samples (OF and OF1-8) as well as two corresponding rapeseed samples (OFS and OFS8), from which OF and OF8 were pressed. Compounds responsible for the successful discrimination are displayed. |
In addition, the identified marker compounds, e.g., 2-phenylethanol, were used to develop a quick method based on headspace solid phase microextraction combined with high-resolution gas chromatography-mass spectrometry (HS-SPME-HRGC-MS) to investigate the rapeseed prior to the pressing process to reduce the risk of any economic damage for the manufacturers.
| 4. Conclusions | ▴Top |
In summary, marker compounds for the fusty/musty off-flavor were identified by combining comprehensive sensorial and instrumental analysis using the sensomics concept combined with statistical evaluation tools. Further, the high similarity between oils and the corresponding seed, from which the oils were pressed (OF and OFS as well as OF8 and OFS8), indicated that already the seed can be subjected to a quick quantitation method used in routine control to analyze the quality of the raw material, which is crucial for the quality of the final oil.
Acknowledgments
The authors thank the skillful assistance of Jakob Drees. This IGF Project of the FEI was supported via AiF within the program for promoting the Industrial Collective Research (IGF) of the German Ministry of Economics and Energy (BMWi), based on a resolution of the German Parliament (AiF 18039 N).
| References | ▴Top |