| Journal of Food Bioactives, ISSN 2637-8752 print, 2637-8779 online |
| Journal website www.isnff-jfb.com |
Original Research
Volume 7, September 2019, pages 63-72
Optimization of extraction of antioxidants from aromatic herbs and their synergistic effects in a lipid model system
Thais Maria Ferreira de Souza Vieiraa, Marilis Yoshie Hayashi Shimanoa, Renan da Silva Limab, Adriano Costa de Camargoa, b, c, *
aDepartment of Agri-Food Industry, Food & Nutrition, “Luiz de Queiroz” College of Agriculture (ESALQ-USP), University of São Paulo, Av. Pádua Dias, 11, P.O Box 9, CEP 13418-900, Piracicaba, Brazil
bDepartment of Biochemistry, Memorial University of Newfoundland, St. John’s, Newfoundland, A1B 3X9, Canada
cDepartamento de Ciencias Vegetales, Facultad de Agronomía e Ingeniería Forestal, Pontificia Universidad Católica de Chile, Casilla 306-22, Santiago, Chile
*Corresponding author: Adriano Costa de Camargo, Department of Agri-Food Industry, Food & Nutrition, “Luiz de Queiroz” College of Agriculture (ESALQ-USP), University of São Paulo, Av. Pádua Dias, 11, P.O Box 9, CEP 13418-900, Piracicaba, Brazil. E-mail: adrianoesalq@gmail.com
DOI: 10.31665/JFB.2019.7200
Received: September 24, 2019
Revised received & accepted: September 30, 2019
| Abstract | ▴Top |
Response surface methodology was applied to improve the polyphenol extraction process of rosemary, oregano, sage, and thyme. Aqueous ethanol (EtOH 50%) rendered the highest polyphenol extraction yield for all tested samples. Based on their total phenolic contents, rosemary, oregano, and thyme were selected for evaluation of their scavenging activities towards DPPH radical and ABTS radical cation and application in an oil model system. All extracts decreased the production of primary oxidation compounds during Schaal oven test storage. The induction period, as evaluated by the Rancimat test, was also reduced. There was an agreement between both oil model system assays, and rosemary extract showed the highest antioxidant capacity, followed by thyme and oregano. A centroid simplex design was used to evaluate the synergistic effect among the samples. Rosemary was able to play a synergistic effect when combined with thyme and oregano, or when used in binary mixtures.
Keywords: Rosemary; Oregano; Thyme; Sage; Phenolic antioxidants
| 1. Introduction | ▴Top |
The consumption of natural products has become a worldwide trend, with the food industry making efforts to respond to the needs. The current demand for new sources of bioactive compounds has been reported in several studies (Carmo et al., 2019; Gremski et al., 2019). Aromatic herbs, which are used as flavoring agents in a variety of foods, also serve as rich sources of phenolic antioxidants. Phenolic-driven sensory changes in functional foods have recently been discussed (de Camargo and Schwember, 2019). Additionally, phenolic compounds may render antimicrobial, anti-inflammatory, anticarcinogenic, and other properties (Opara and Chohan, 2014; Falcão et al., 2019; Shahidi et al., 2019). Likewise, the inhibition of alpha-glucosidase and lipase, which participate in the breakdown of carbohydrates and triacylglycerols, has been reported (Bautista-Expósito et al., 2018). Therefore, phenolic compounds may be helpful in the management and/or prevention of type 2 diabetes and obesity.
Antioxidants delay and/or prevent the oxidative processes of lipid-rich as well as other foods, such as low moisture breakfast cereals, among others. They can be either from synthetic origin [e.g., butylated hydroxyanisole (BHA), butylated hydroxytoluene (BHT), and tert-butylhydroquinone (TBHQ)] or extracted from natural sources. Natural antioxidants have been investigated in order to replace the synthetic compounds due to the concerns related to their potential carcinogenic and other adverse health effects (Taghvaei and Jafari, 2015). Since the eighties (Witschi, 1986; Verhagen et al., 1991), some authors have raised the potentially detrimental effects of synthetic antioxidants on health. In fact, there is sufficient evidence to support the carcinogenicity of BHA (Verhagen et al., 1991). Cytotoxic effects of BHA in synergistic combination with Δ9-tetrahydrocannabinol (THC) were reported by Sarafian et al. (2002). Likewise, Witschi (1986) reported the carcinogenic effect of BHT in animal models. Additionally, Imhoff and Hansen (2010) emphasized that the toxicity and carcinogenic potential of compounds such as TBHQ should not be neglected. However, mention should be made that the negative aspects highlighted must not overshadow their benefits as often experimental animals are over-loaded with such compounds, and the adverse effects may have been exaggerated.
Lipid oxidation is a significant problem for the food industry, leading to unpleasant sensory changes, which vary in intensity depending on the product (da Silva et al., 2014). Many reports reveal the protective action of herb extracts against lipid oxidation in food systems (Almeida-Doria and Regitano-d’Arce, 2000; Shan et al., 2011; Racanicci et al., 2004). Their antioxidant properties are mainly correlated to their phenolic compounds (e.g., caffeic acid, rosmarinic acid, carnosic acid, carnosol, rosmanol, thymol, carvacrol, catechin, kaempferol) (del Bano et al., 2003; Shan et al., 2005; Zheng and Wang, 2001). The antioxidant properties of each herb depend on its phenolic profile and mechanism of action (Embuscado, 2019). Furthermore, synergistic, additive, and/or antagonistic relationships between different phenolic compounds must be considered.
Spices are often used in combination not only in the food industry but also in homemade meals. However, information on the synergistic antioxidant effect of herb mixtures remains scarce. Accordingly, the present study evaluated the best extraction conditions to recover phenolic antioxidant compounds from four herbs using response surface methodology (RSM) central composite design. Furthermore, the radical scavenging activity was investigated towards DPPH (2,2-diphenyl-1-picrylhydrazyl) radical and ABTS (2,2′-azino-bis-(3-ethylbenzothiazoline-6-sulphonic acid) radical cation. The synergistic antioxidant capacity was investigated in two oil model systems using RSM centroid simplex experimental design.
| 2. Material and methods | ▴Top |
2.1. Extraction process
Dried herbs: rosemary (Rosmarinus officinalis L.), oregano (Origanum vulgare L.), thyme (Thymus vulgaris L.), and sage (Salvia officinalis L.) were obtained from a local market in São Paulo, Brazil. The samples were ground and stored in a refrigerator at 7 °C until further analyses. Refined-bleached-deodorized (RBD) soybean oil free from synthetic antioxidants was kindly donated by Cargill and kept frozen (−18 °C) until further analyses.
The extraction of phenolic compounds was performed by mixing dried spices (3.0 g) with ethanol/water (30 mL) in a water bath, according to Lugemwa (2012). Different concentrations of ethanol/water (0, 15, 50, 85, and 99%) and temperatures (30, 35, 45, 55, and 60 °C) were used as established by the experimental design. All extractions were carried out for 50 min, and the extracts were centrifuged at 4,000 g for 20 min. The supernatant was collected and filtered on a filter paper Whatman n° 2. The extracts were stored at 7 °C in amber vials (within 5 days) until the moment of analysis.
2.2. Total phenolic content (TPC)
TPC was determined spectrophotometrically, according to Swain and Hillis (1959). Appropriate dilutions of the extracts (0.5 mL) were transferred to screw-cap tubes and mixed with 1:10 (v/v) aqueous solutions of Folin-Ciocalteau reagent (2.5 mL). The tubes were shaken, and after 5 min, a 4% sodium carbonate solution (w/v) was added (2.0 mL). The tubes were kept in the dark for 2 h, and the absorbance was then read at 740 nm using a UV-1203 spectrophotometer (Shimadzu Corporation, Kyoto, Japan). The results were expressed as gallic acid equivalents (GAE) per gram of dry sample.
2.3. Radical scavenging activity (RSA)
The extracts that rendered the highest TPC values according to the RSM were evaluated for their RSA towards DPPH radical and ABTS radical cation.
2.3.1. DPPH radical scavenging activity
The antioxidant activity was evaluated using the DPPH (2,2-diphenyl-1-picrylhydrazyl) radical assay, proposed by Brand-Williams et al. (1995) and described by Augusto et al. (2014). Phenolic extracts (0.5 mL) were mixed with a 60 μM DPPH ethanolic solution (3.0 mL). The absorbance was read at 517 nm using a UV-1203 spectrophotometer (Shimadzu Corporation), after 45 min standing in the dark. The DPPH radical scavenging activity was calculated using the equation below, and the results were expressed as Trolox equivalents (TE) per gram of dry sample (μmol TE/g dry weight).
2.3.2. ABTS radical cation scavenging activity
The ABTS radical cation scavenging activity was evaluated according to Re et al. (1999), as previously described (Augusto et al., 2014). The ABTS radical cation (2,2′-azino-bis(3-ethylbenzothiazoline-6-sulfonic acid), which is generated by oxidation with potassium persulfate, was used in ethanolic extracts. A 7.00 mM stock solution of ABTS was prepared one day before the analysis, and the working solution was prepared by diluting the stock solution until it reached 0.70 ± 0.02 at an absorbance wavelength of 734 nm. The diluted extracts (20.00 μL) were mixed with the ABTS radical cation work solution (2.00 mL), and the absorbance was spectrophotometrically (UV-1203, Shimadzu Corporation) read at 734 nm after 6 min of reaction. The ABTS radical cation scavenging activity was calculated using the equation below, and the results were expressed as μmol TE/g dry weight.
2.4. Antioxidant capacity in an oil model system
2.4.1. Hydroperoxide content under Schaal oven test condition
The Schaal oven test was carried out as previously reported (Vieira and Regitano-d’Arce, 1999) with slight modifications. Vials with RBD soybean oil (1.5 mL) were mixed with an individual, binary, or ternary herb extracts combination and subjected to the Schaal oven test at 60 °C for eight days. The hydroperoxide content was determined by measuring the formation of ferric ion complex using spectrophotometry, according to Shantha and Decker (1994), with modifications described by de Camargo et al. (2016). For better comprehension, all solutions are explained first. Solution 1: BaCl2 (0.132M) was prepared in HCl (0.4 M). Solution 2: Fe+2 (0.072 M) was obtained from the mixture (1:1, v/v) of FeSO4 (0.144) and BaCl2 (0.132M). Solution 3: NH4SCN:Fe2+ (1:1, v/v) was obtained by mixture of NH4SCN (3.94 M) and Fe+2 (0.072 M). For analysis, RBD soybean oils were weighed (0.3 g) and mixed with 1.5 mL iso-octane/2-propanol solution (3:1, v/v). The mixture was vortexed, and 200 µL of the solution obtained was mixed with 2.8 mL methanol/n-butanol (2:1, v/v). Finally, 30 µL of NH4SCN:Fe2+ (1:1, v/v) was added. The tubes were incubated at room temperature for 20 min. The absorbances were read at 510 nm using a UV-1203 spectrophotometer (Shimadzu Corporation). The hydroperoxide content (mmol LOOH/L oil) was calculated using a standard curve of cumene hydroperoxide. Likewise, the UV absorption was evaluated to support the generation of primary oxidation products, such as conjugated dienes. The absorbance at 232 was determined using the same equipment following the Ch 5–91 method from AOCS (2003).
2.4.2. Oil stability index
The induction period was evaluated using a Rancimat 743 apparatus (Metrohm Corporation, Herisau, Switzerland), as previously explained. The oil samples (5.0 g) in the presence of single, binary, or ternary extract mixtures were transferred into a vessel and heated to 110 °C and dry airflow of 9 L/h. The induction period was expressed in hours (h).
2.5. Experimental design and statistical analysis
In the first design, the goal was to optimize the extraction of phenolic compounds after which three of them were further investigated for their synergistic effect. The central composite design of two factors/five levels was applied to evaluate the yields of the extraction process as a function of TPC. Runs 9–12, which represented the central point, allowed to estimate the variation in the responses at the central point and provided a basis for the lack-of-fit test (Rheem and Oh, 2019). The independent variables were ethanol concentration (% EtOH, v/v) and temperature (°C). The range and levels of the explanatory variables were, as follows: coded value −1.41 (0% ethanol, 30 °C), −1 (15% ethanol, 35 °C), 0 (50% ethanol, 45 °C), 1 (85% ethanol, 55 °C), 1.41 (99% ethanol, 60 °C). Experimental data were analyzed with the software Statistica 11. The study of the effect of the extraction conditions was performed by response surface methodology and multiple regression analysis. Second-order mathematical models, including linear and quadratic terms, and interactions between independent variables were fitted to define the optimum conditions for extraction of TPC from each herb. The models were evaluated based on the coefficient of determination (R2) and F tests. The fitted model formula is represented by the equation below:
To study the correlation between TPC and the antioxidant capacity as evaluated by DPPH and ABTS assays, Pearson’s correlation analyses (p < 0.01) and (p < 0.05) were carried out using the ASSISTAT 7.6 software.
The second design was planned to investigate the potential synergistic effect of the three herbs selected according to their TPC yield obtained in the first design. A simplex centroid design was used. The data were analyzed by one-way analysis of variance (ANOVA), considering a level of 5% significance. Based on the experimental design, a cubic model was fitted with the equation below:
Statistical analyses were conducted using the Statistica 11 software.
| 3. Results and discussion | ▴Top |
3.1. Extraction process and total phenolic content (TPC)
Different solvents (e.g., acetone, methanol, ethanol, diethyl ether, water, and ethyl acetate) are commonly employed in the extraction of polyphenols. From a toxicological standpoint, ethanol and water are safer than other organic solvents; thus, more acceptable for food applications. Indeed, ethanol and water, individually or in combination, have effectively been used in the extraction of phenolic compounds (Almeida-Doria and Regitano-d’Arce, 2000). In the present study, an ethanol/water mixture was chosen as the solvent for the extraction process. Phenolics present in the test samples have already been reported (Shimano, 2019). Caffeic and dihydrocaffeic acids were identified in all herbs, while vanillic acid methyl ester of p-hydroxybenzoic acid was detected only in rosemary. The presence and identities of other phenolics in these spices are already available in the existing literature (Shahidi and Ambigaipalan, 2015; Shahidi and Hossain, 2018).
It is well accepted that several factors such as ethanol percentage, temperature, extraction time, particle size, and the solvent/solid ratio may affect the extraction process, independently, or via interactions. In the present study, the temperature was chosen as the second parameter to be investigated.
RSM determined the optimal conditions for the extraction of phenolic compounds from herbs. Phenolics from different plant sources have been reported to display antioxidant action against reactive oxygen species (Chandrasekara and Shahidi, 2011; Melo et al., 2015). Based on the highest TPC observed in the first design (Table 1), three herbs were selected for in vitro antioxidant investigations (ABTS and DPPH methods) and further application in lipid model systems (Schaal oven test and oil stability index). Polyphenols from selected herbs were studied for their antioxidant capacity as well as their synergistic effect as binary or ternary mixtures.
 Click to view | Table 1. Total phenolic content of extracts of selected herbs |
In the first design, a central composite design was used to investigate the effects of two independent variables—ethanol concentration (% EtOH) and temperature (T)—on TPC (Table 1). TPCs ranged from 13.31 to 58.92 (rosemary), from 21.49 to 98.82 (oregano), from 12.69 to 53.91 (sage), and from 20.07 to 67.11 (thyme), with respective mean values of 42.50, 79.11, 34.00, and 49.99 mg GAE/g dry weight. However, the optimization of the extraction procedure is equally important, as demonstrated in the present study, where TPC was increased up to 4.6-fold under optimal conditions.
Kim et al. (2011) reported the TPC of 13 spices commonly used in meat processing plants. According to these authors, TPCs were as follows: clove > thyme > savory > rosemary > oregano, basil, and marjoram > caraway, cumin, fennel, coriander, turmeric, and mace. In this study, oregano presented the highest TPC, followed by thyme, rosemary, and sage, respectively. Taking into account oregano, thyme, and rosemary, the data from the present study is in agreement with the findings of Kim et al. (2011) for thyme and rosemary, which is not the case for oregano. Nevertheless, this discrepancy is not uncommon, since TPC can be affected by several factors such as cultivar, geographic origin, harvest time, among others (Shahidi and Ambigaipalan, 2015; Shahidi and Hossain, 2018).
The ANOVA of the regression models for rosemary, oregano, sage, and thyme extracts showed that the models were significant (p < 0.05), with F-values of 22.8, 88.3, 31.6, and 53.9, respectively (Table 2), and they were all three-fold higher than F tabulated. The R2 values were also higher than 0.92. Furthermore, there was no significance in the lack of fit (p > 0.05). These indicated the predictive capacity of the models. An ideal model should have good significance (p > 0.05), high reliability (data within the range of 95%) and low variability (R2 > 70%). The models were fit considering only the significant effects for rosemary (Equation 3), oregano, (Equation 4), sage (Equation 5), and thyme (Equation 6).
Click to view | Table 2. Variance analysis of regression models fitted to experimental designs of TPC of selected herbal extracts |
The extraction process was significantly affected by ethanol concentration and temperature. However, interactions of ethanol percentage and temperature were not significant for any of the tested samples. The quadratic effect of ethanol percentage showed the highest absolute value, i.e., with the most significant impact on the TPC of all spices, followed by its linear effect. The linear effect of ethanol percentage in all extracts was negative, meaning that an increase in this factor caused a decrease of TPC. Temperature showed a positive linear effect, indicating that increases in the temperature also led to increases in the response. However, TPC from oregano extract was not affected by changes in the temperature. For all extracts, the mathematical models presented negative quadratic parameters, indicating that surfaces have passed by the maximum TPC value.
For rosemary and thyme extracts, the linear and quadratic effects of ethanol percentage, as well as the quadratic effect of the temperature were negative; the linear effect of the temperature was positive. The linear and quadratic effects of explanatory variables in sage extracts were similar to those of rosemary and thyme. However, the quadratic effect of temperature was not significant. For oregano, only the linear and quadratic effects of ethanol percentage affected the TPC.
Figure 1 shows the response surfaces of the extraction process. An increase from 30 to 45 °C produced extracts from rosemary and thyme with higher TPC. Sage showed increases in the TPC, with the temperature rising from 30 to 60 °C. It has previously been reported that changes in the temperature from 20 to 60 °C causes increases in the TPC of oregano and thyme (Rababah et al., 2010).
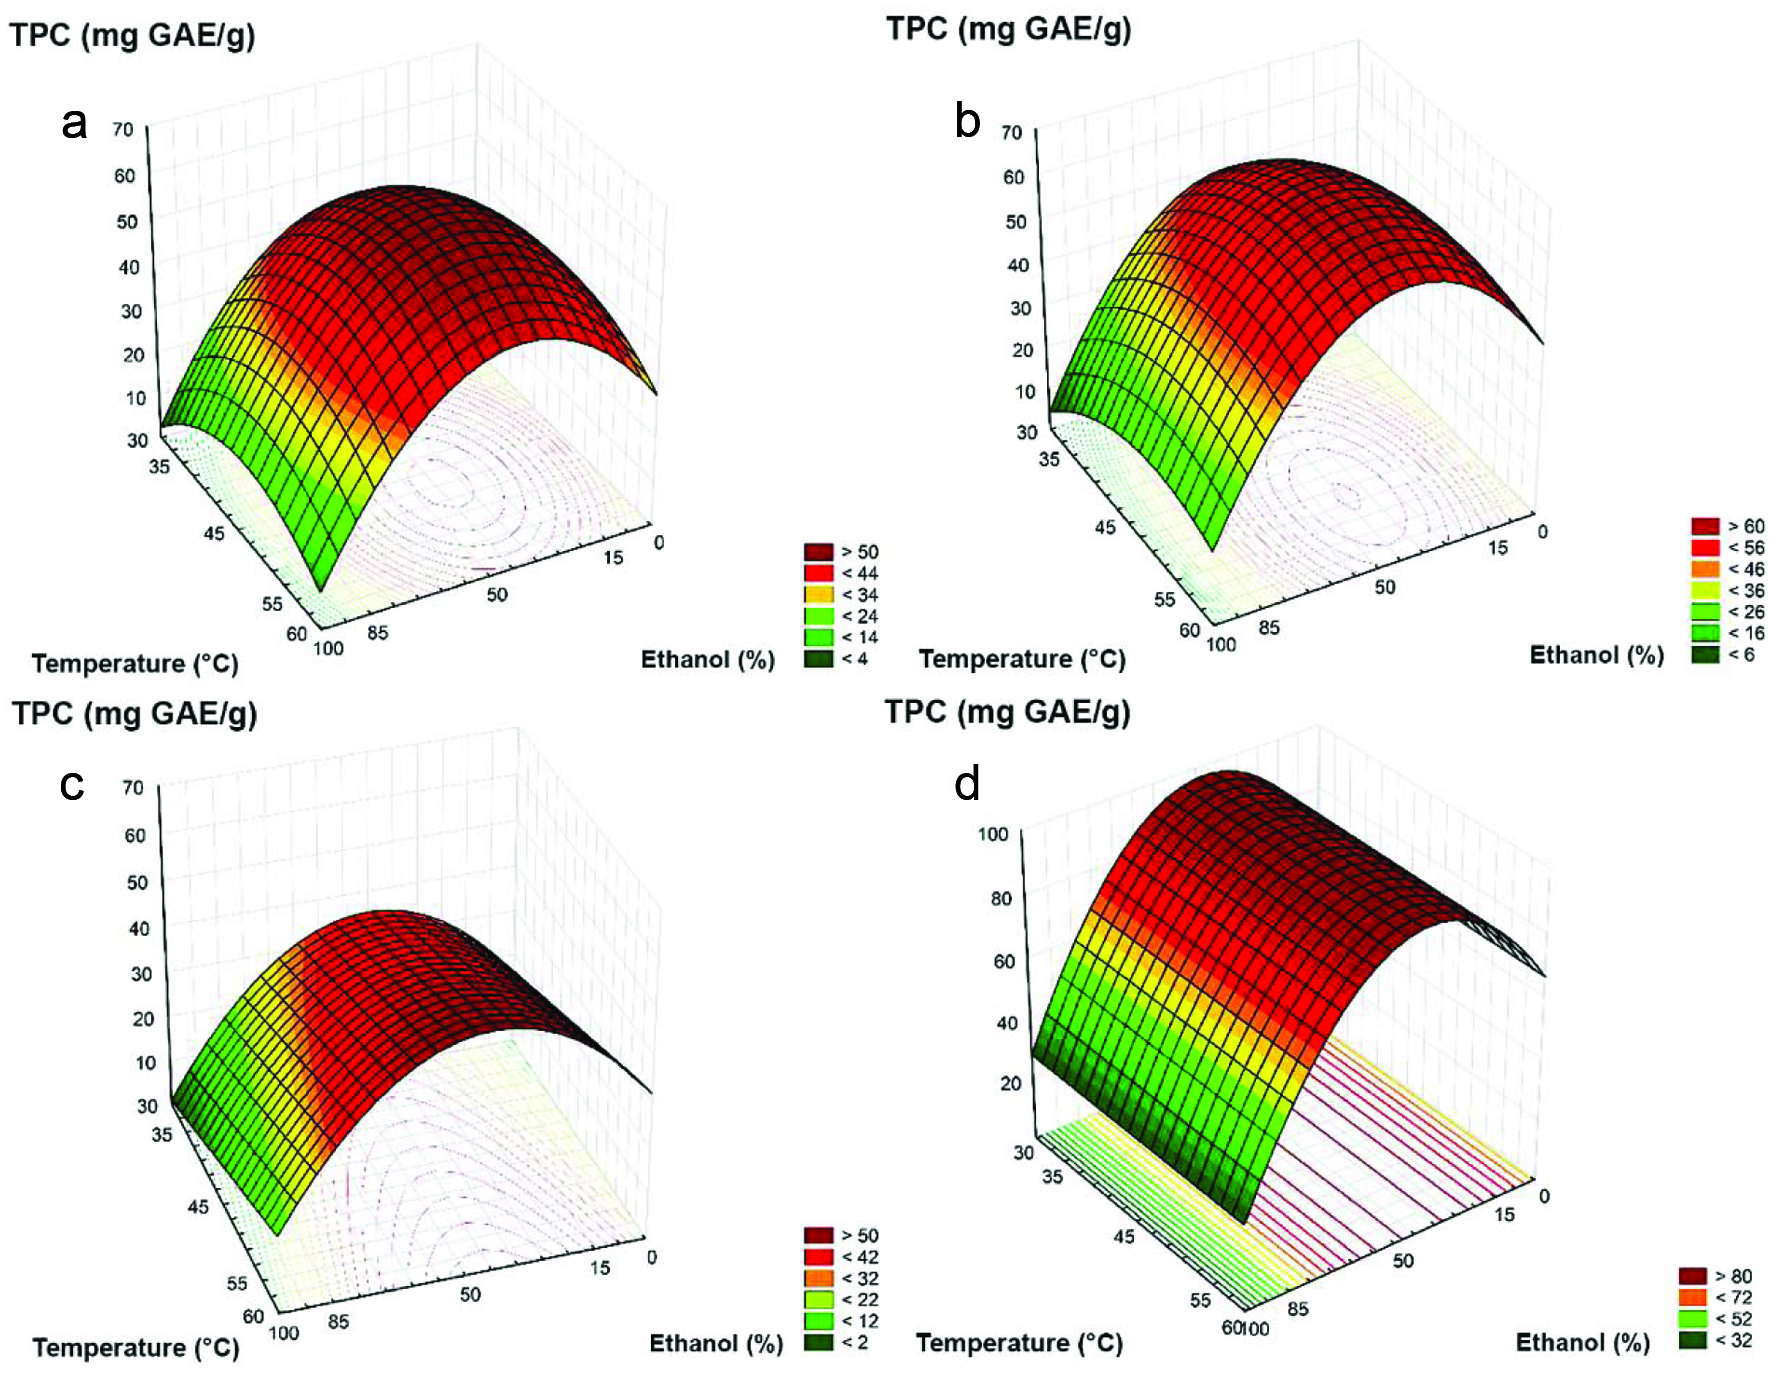 Click for large image | Figure 1. Effect of ethanol percentage and temperature on total phenolic content in (a) rosemary; (b) thyme; (c) sage; (d) oregano extracts. TPC, total phenolic contents; GAE, gallic acid equivalent. |
Based on the response surfaces obtained, the conditions for efficient extraction of the phenolic compounds were: EtOH 50% at 45–50 °C (rosemary and thyme), EtOH 50% and temperature from 57.5 to 60 °C (sage), and EtOH 40–50% at any temperature ranging from 30 to 60 °C (oregano). Based on the TPC, oregano, thyme, and rosemary with their respective best extraction conditions were selected for further analysis.
3.2. Radical scavenging activity (RSA)
The RSA towards DPPH radical ranged from 295.6 to 178.0 μmol TE/g (Table 3), while the RSA towards ABTS radical cation varied from 520.8 to 239.0 μmol TE/g. Regardless of the method employed, oregano showed the highest RSA, followed by thyme and rosemary. Furthermore, a high positive significant correlation (p < 0.01) was found between TPC and both RSA assays, which demonstrates that the antioxidant activity of the samples is dependent on their phenolic content.
Click to view | Table 3. Antiradical activities and corresponding Pearson’s correlation with total phenolic contents (TPC) of selected extracts of herbs |
The antioxidant activities of phytochemicals depend not only on the presence of polyphenols but also on their chemical structure. Thus, the high correlation between RSA assays with TPC is not always true. The structure-activity relationship has already been discussed by Rice-Evans et al. (1996). The high correlation found in the present study agrees with the work of Kim et al. (2011), who reported a high correlation between TPC and DPPH for hot water extracts of 13 spices. Their work also supports the information that the strength of correlation depends on the polyphenols present. According to these authors, the TPC showed a high positive correlation (r = 0.9158, p < 0.001) with DPPH whereas in the same assay the flavonoid content exhibited a moderated correlation (r = 0.5430, p < 0.05). It is noteworthy that the correlation depends on the antioxidant method employed. The same authors found no correlation between TPC and hydroxyl radical scavenging activity or superoxide radical anion scavenging activity. However, the high correlation with DPPH is useful to anticipate at some point if one feedstock may exhibit antioxidant capacity in bulk oils (Arranz et al., 2008). Correlations between TPC and ABTS were also reported as classified by botanical families in the study of Wojdylo et al. (2007), where the botanical family had a significant influence on the correlation. The authors found positive correlations only for herbs belonging to Labiatae and Compositae family groups when compared to several others.
3.3. Antioxidant capacity in an oil model system
To evaluate the actual antioxidant capacity of the herb extracts, a refined-bleached-deodorized (RBD) soybean oil free from synthetic antioxidant was used as the oxidizable feedstock. RBD soybean oil was chosen due to its relatively high unsaturated fatty acid content. Schaal oven test was applied to evaluate the antioxidant capacity using a mild temperature (60 °C). Every two days, the oxidation status was assessed using the hydroperoxide content and UV absorption (232 nm) results, which represent the primary oxidation products.
The ability of the extracts in inhibiting oxidation under extreme conditions, combining high temperature and oxygen-induced oxidation, was also evaluated using oil stability index (OSI) method using a Rancimat. This is an automated, efficient, and low-cost method widely used by the industry. Thus, the results achieved may be helpful for future comparison and easy reproduction.
Based on TPC values, oil samples were prepared with each extract (100 mg GAE/kg oil) and their binary (50 mg GAE/kg oil for each extract) and ternary (33.3 mg GAE/kg oil for each herb) mixtures. The extraction conditions were based on preliminary studies (Table 1). The ability of individual and combined herb extracts in preventing oxidation in the oil model system is summarized in Table 4.
Click to view | Table 4. Hydroperoxide content (mmol LOOH/L oil)1, absorbance at 232 nm, and induction period of soybean oil with added herbal extracts subjected to thermal oxidation under Schaal oven test condition (60 °C) and Rancimat testing at 110 °C |
The correlation between hydroperoxide concentration and conjugated dienes increased throughout the experiment and became significantly correlated (p < 0.01) on the sixth (r = 0.9483) and eighth (r = 0.9981) days. The highest correlation was found on the eighth day. Thus, such data were chosen to fit the models (Fig. 2a, b). The antioxidant capacity of rosemary and oregano ethanolic extracts in soybean oil during thermal oxidation has already been reported by Almeida-Doria and Regitano-d’Arce (2000). The literature also provides information on the synergistic effect of individual phenolics using centroid simplex design (Capitani et al., 2009). However, a literature search reveals that there are knowledge gaps regarding common sources of natural antioxidants such as spices. Therefore, the present work may be helpful for future studies and applications of new herb combinations or other sources of phytochemicals presenting a synergistic effect.
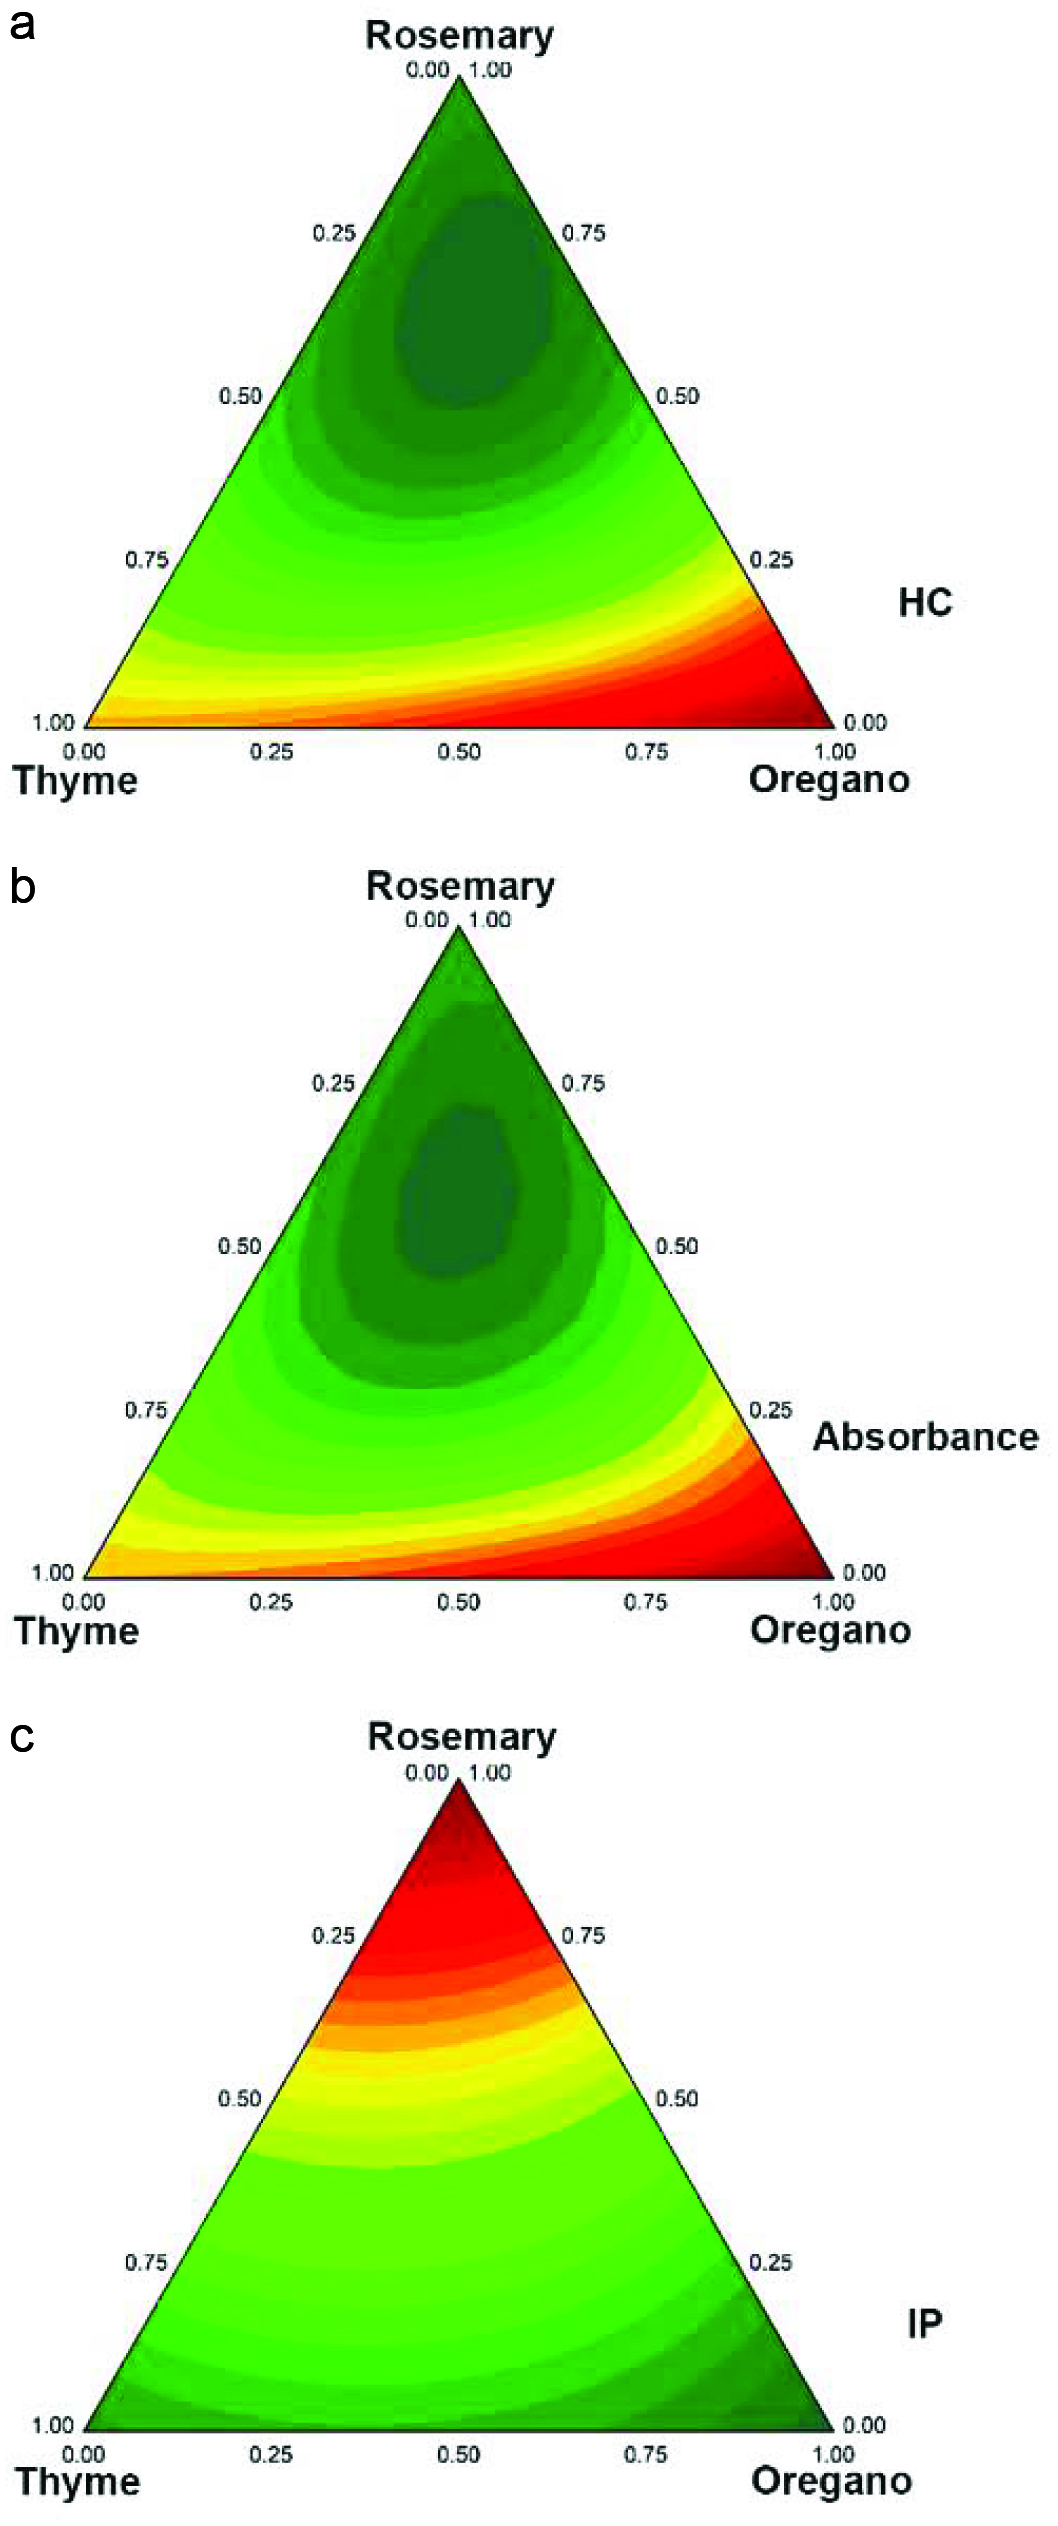 Click for large image | Figure 2. (a) Hydroperoxide content (HC); (b) UV absorbance at 232 nm of RBD soybean oil in oven test (60 °C) on day 8 and C: Induction period (IP) of RBD soybean oil in Rancimat test. The hydroperoxide content (mmol LOOH/L oil) was calculated using a standard curve of cumene hydroperoxide. The UV absorption at 232 nm indicates the generation of primary oxidation products (e.g. conjugated dienes). The induction period was expressed in hours. |
The F calculated by analysis of variance (ANOVA) was higher than the F tabulated (Table 5). If F calculated is three-fold higher than F tabulated, the model can be used for prediction purposes. In fact, the F-values of 26.2 (hydroperoxide content), 24.13 (absorbance at 232 nm), and 151.17 (induction period) were up to 39 times higher than the F tabulated. Thus, the fit models were valid. The R2 coefficients were 0.9181, 0.9118, and 0.9923 for hydroperoxide content, UV absorbance, and induction period, respectively.
Click to view | Table 5. Variance analysis of regression models fitted to experimental designs of hydroperoxide content and absorbance at 232 nm |
Mixtures with three components follow the equation x1 + x2 + x3 = 1, which is equivalent to an equilateral triangle in a cube. The vertices correspond to pure extracts, the edges are binary blends, and the points inside the triangle represent the possible ternary blends. A simplex-centroid design consists of 2q – 1 points, where q corresponds to the components (Myers et al., 2009).
The antioxidant capacity of the extracts in RBD soybean oil, as shown by the hydroperoxide content, was effective when ternary or binary mixtures had rosemary in their combination. The antioxidant capacity evaluated by UV absorption is in good agreement with the results evaluated by hydroperoxide content. Among individual extracts, oregano showed the most significant antioxidant capacity as assessed by hydroperoxide content and UV absorption, which was followed by thyme and rosemary, respectively. Taking into account the hydroperoxide contents, UV absorption, and TPC, it is possible to infer that the polyphenols extracted from rosemary exhibited more oxidative protection in RBD soybean oil model system and can be used to induce synergistic protection when combined with thyme and oregano or only with thyme or oregano individually.
The Rancimat is an apparatus developed and dedicated to the determination of oil stability index (OSI), which is expressed as an induction period in hours. This test is based on inducing the oil oxidation through continuous aeration at high temperatures. Volatile compounds, formed by hydroperoxide decomposition in secondary oxidation stages, travel to the water, altering its conductivity, which is recorded by the equipment (Velasco et al., 2009). The increase in water conductivity is mainly due to the formation of acetic and formic acids, which are produced by the breakdown of aldehydes, the major secondary oxidation products. The time until such products are detected is called induction period. Therefore, the higher the induction period, the more effective is the antioxidant (Loury, 1972).
The induction period of the RBD soybean oil in the presence of herb extracts is shown in Table 4. In this method, the oil was exposed to higher temperatures (110 °C) when compared to the Schaal oven test (60 °C). Phenolic compounds may be less stable at higher temperatures due to extreme conditions of accelerated oxidation. Thus, some loss in their antioxidant activity may occur as a consequence of the degradation of their phenolics into oxidized compounds. However, a significant negative correlation (p < 0.05) existed between hydroperoxide content (r = −0.7978) and Rancimat test or UV absorption (r = −0.7925) and Rancimat test, which demonstrates the same trend among different assays. Fig. 3a–c shows the percentage of inhibition of hydroperoxides, conjugated dienes, and oxidation in the Rancimat test. According to the surface response, the worst performance was obtained when oregano extract alone was added to RBD soybean oil, which agrees with the data from the Schaal oven test. The regression was statistically significant (Fcalculated > Ftabulated), and the R2 coefficient was elevated. Thus, it was possible to fit a model to explain the variations (Fig. 2c and Table 6).
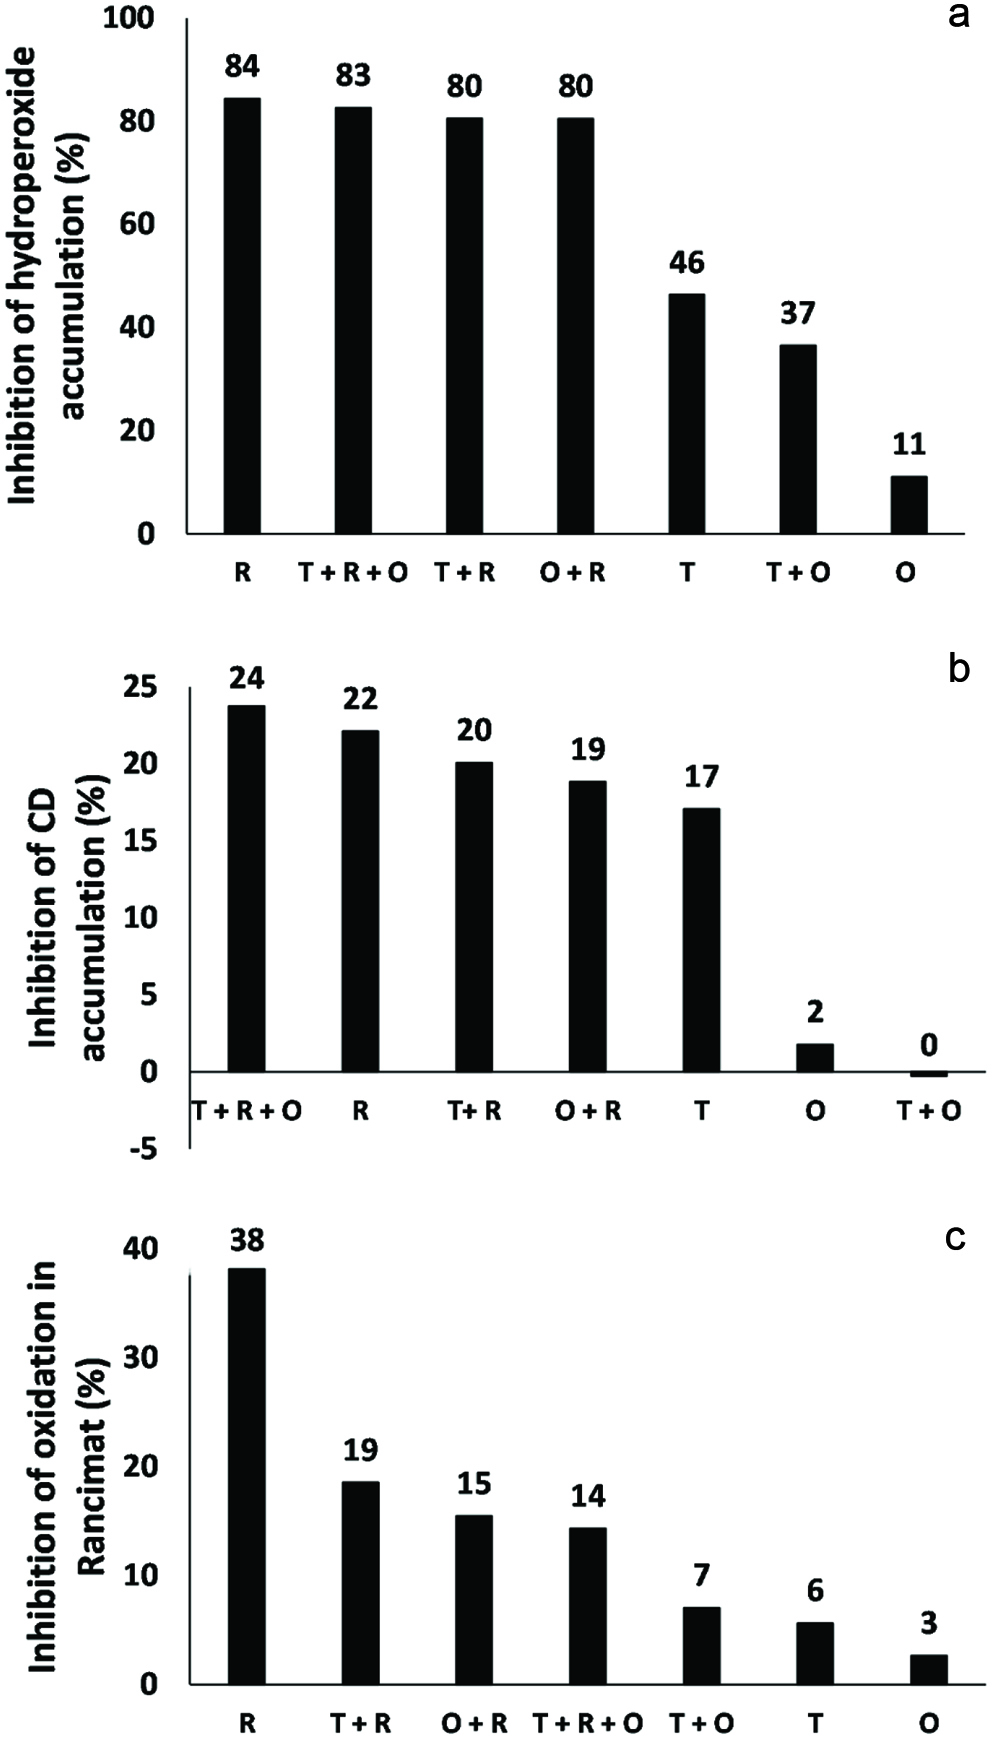 Click for large image | Figure 3. Inhibition percentage of phenolics from herb extracts against (a) hydroperoxide and (b) conjugated diene accumulation and (c) oxidation in Rancimat test. R is rosemary, T is Thyme, and O is oregano. |
Click to view | Table 6. Special cubic polynomial models of the synergistic effects of mixtures containing phenolic extracts of thyme, oregano and rosemary |
An apparent synergistic effect can be noted when rosemary is taken into account. Phenolics from thyme and oregano inhibited the hydroperoxide generation by 46 and 11%, respectively. However, when combined with those from rosemary, the inhibition increased to 80% in both cases (thyme + rosemary or oregano + rosemary). The same behavior was observed for the inhibition of the formation of conjugated dienes (primary oxidation compounds). In fact, phenolics from oregano enhanced inhibition of formation of conjugated dienes from 2 to 19% when in combination with rosemary (Figure 3). Phenolics from thyme combined with those extracted from rosemary also showed a higher antioxidative effect against conjugated dienes generation when compared with thyme alone. Finally, when combined, phenolics from thyme and rosemary promoted inhibition by 18% in the Rancimat test. In contrast, a lower inhibition (6%) was observed when phenolics from thyme were used alone. The oxidation inhibition of oregano increased from 2.7% (oregano) to 15% (oregano + rosemary). Therefore, the synergistic effect of rosemary was demonstrated in all model systems. Some other studies have employed RSM to improve the extraction of phenolics from other plant materials (Jovanović et al., 2017; Li et al., 2012; Majeed et al., 2016). However, none of them have used this tool to screen the synergistic effect of the obtained extracts in a lipid model system. Finally, predicted values supported those found during our experiments (data not shown). Therefore, this contribution extends the current knowledge and/or application of RSM.
| 4. Conclusions | ▴Top |
The aqueous ethanol (EtOH 50%) yielded the highest total phenolic content (TPC) for all herbs, while the temperature exhibited a different effect for each one of them. A high positive correlation was found between TPC and the antiradical activity towards DPPH radical and ABTS radical cation. DPPH and ABTS assays may be used for initial screening. However, results obtained from practical applications are more relevant. Polyphenols from rosemary had higher antioxidant capacity than the other extracts tested against the production of primary and secondary oxidation compounds in the oil model system subjected to accelerated thermal oxidation. The antioxidant capacity in a refined-bleached-deodorized soybean oil model system can be ranked as rosemary > thyme > oregano. Furthermore, rosemary extract showed a synergistic effect when combined in equal concentration with thyme and oregano (ternary mixture, 33.3 mg GAE/kg oil for each herb) or in a binary mixture with thyme or oregano (50 mg GAE/kg oil for each herb). This study was an initial step in the production of polyphenol-rich herb extracts aimed to be used as natural antioxidants in food formulations from vegetable and/or animal origin.
Acknowledgments
M.Y.H.S acknowledges CAPES - National Council for the Improvement of Higher Education (Finance Code 001).
| References | ▴Top |